
The Fibonacci SuperTrend indicator is based on one of my favorite swing trading strategies to date. While the strategy is fairly simple, the description is a bit lengthy for this post. However, there is a detailed video on the trading strategy by clicking the button below.
The Original SuperTrend Indicator
The SuperTrend indicator is a very common tool used amongst traders. It is widely available for free download across the Web. Typically it is used as a method of determining trend direction, and is often used as a trailing stop or entry method. The SuperTrend indicator is usually displayed similar to that in the image below.
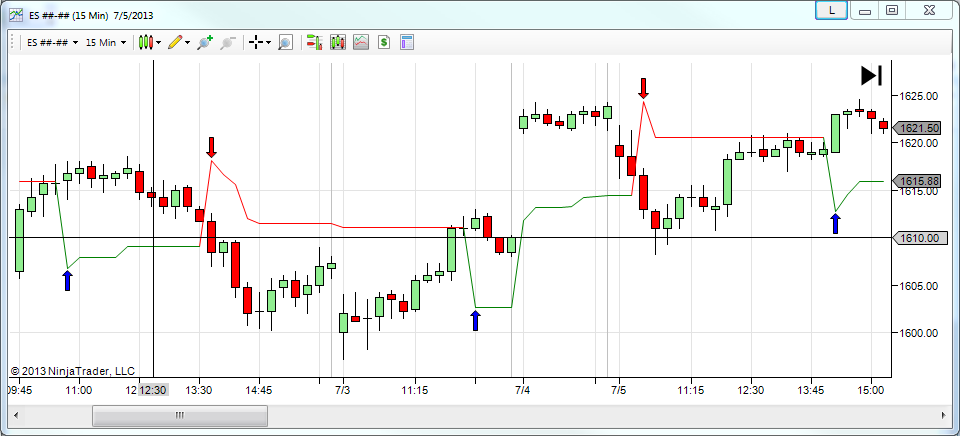 The indicator itself is fairly simple. The first thing the indicator looks for is to establish a trend in the market. When the trend is bullish, the indicator will plot a green line below the market. When the market trades below the green line, the trend changes to bearish and the indicator plots a red line above the market. The calculations for the green and red lines are dependent on the Average True Range indicator, and a user defined Multiplier parameter.
- Green: Market Price – Average True Range * Multiplier
- Red: Market Price + Average True Range * Multiplier
The one caveat is that in in a bullish market, the green line is not allowed to decrease in value. Likewise, in a bearish market the red line is not allowed to increase in value.
The Fibonacci Based SuperTrend indicator
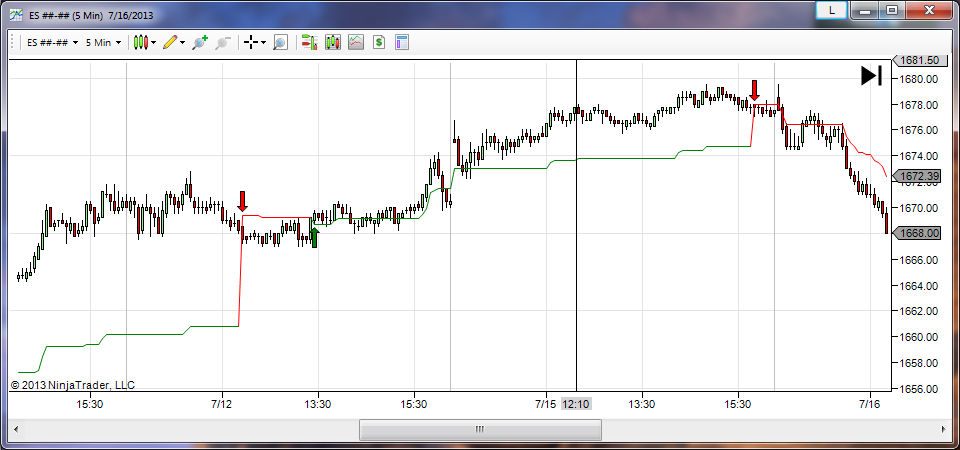
The Fibonacci SuperTrend indicator looks similar to the original SuperTrend indicator. The indicator starts be establishing a Trend in the market. The Fibonacci SuperTrend defines trends according to breakouts in the market. A bullish trend starts when the market breaks above the highest high of the previous ‘x’ bars, where ‘x’ is a user defined value. The bullish trend will continue until the market breaks below the lowest low of the previous ‘x’ bars.
While the market is in a bullish trend, the indicator will track the highest point reached by the market. Similarly, when the market is in a bearish trend, the indicator will track the lowest point reached by the market. The calculations for the green and red lines are quite simple. The first thing we must calculate is the range between the highest and lowest points tracked in our bullish and bearish trends:
- Range = Highest Point of most recent Bullish Trend – Lowest Point of most recent Bearish Trend
Once we have calculated the range, we can calculate the values of the green and red lines:
- Green: Highest Point of Bullish Trend – (.382 * Range)
- Red: Lowest Point of Bearish Trend + (.382 * Range)
The Fibonacci Based SuperTrend can be used in Futures, Forex, and Equities trading. This indicator for NinjaTrader includes the following features:
- Optional Arrows to show when the trend has reversed
- Optional Audio Alerts when the trend has reversed
- Optional Coloring of Price bars to show the trend
- Plot lines to show the user where the trend is most likely to reverse
Download Now:
Click the link below to download our Free Fibonacci Super Trend indicator for NinjaTrader:
NinjaTrader 7:
Fibonacci SuperTrend for NinjaTrader 7 (3829 downloads)
NinjaTrader 8:
Fibonacci SuperTrend Indicator for NinjaTrader 8 (3004 downloads)

10 comments
Skip to comment form
Wow!Thanks!
Author
No problem. I’m glad you like the free NinjaTrader indicator. Don’t forget to share this with your friends on Twitter, Facebook, etc.
I like this indicator a lot!
It would be good if it included values in the code that could be used in a NT Market Analyzer column to indicate the reversal arrows when they occur. Is this possible?
Author
It is certainly possible. Please visit the Custom Programming link above for modification requests.
I am sure it is straight forward and i missed it but can you say how to use this in NT GUI. even something simple like when in a long trend enter long and vice versa. I see the use of +1 and -1 but it did not work as a varible to enter
Author
Alex,
I’m sorry but I’m not sure I understand your question. What do you mean when you refer to the “NT GUI”? Are you referring to the Strategy Wizard window?
Hi Im trying to use this in a strategy but am having a problem using the ‘add’ function in the strategy to get it to work. Im sure i am just missing something in the syntax. is there an example of how to bring it into a strategy? Thanks
Author
Try the following:
Add(FibonacciSuperTrend("Alert1.wav",true,true,20,0.382,true,true));Do you have an NT8 version of the Fib Supertrend indicator?
Author
There is not a version of the indicator for NinjaTrader 8 yet. It will be coming in the near future.