MACD BB Indicator
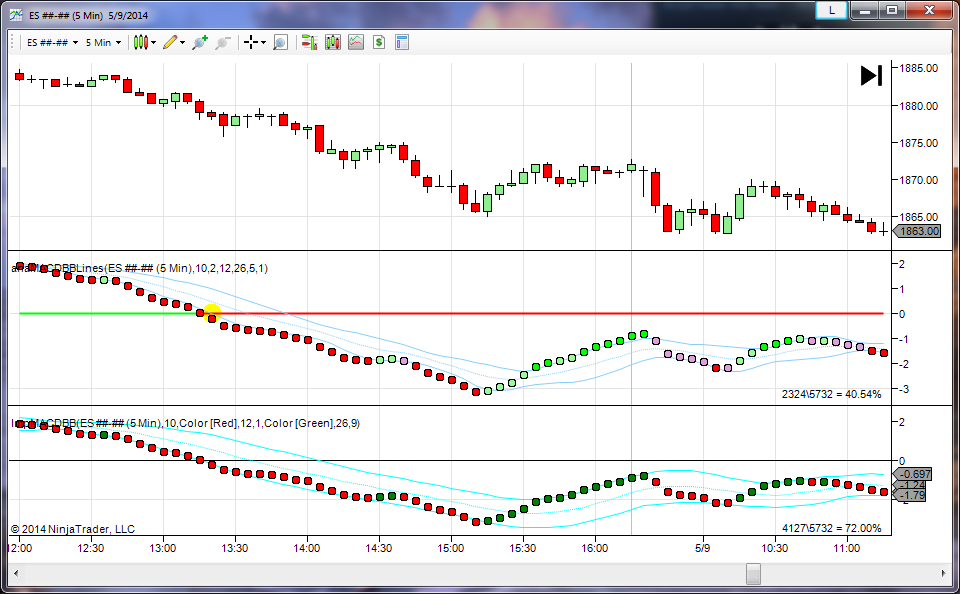
What makes our modified MACD BB indicator for NinjaTrader better than the original version? Both the MACD and Bollinger Band indicators are simple yet effective tool for measuring overbought and oversold conditions in the markets. Bollinger Bands will plot a channel based on historical market prices and volatility. The center of the channel is generally calculated using a simple moving average of the market price. The upper and lower bands are then calculated by adding and subtracting a multiple of the Standard Deviation (used to measure volatility) from the center of the channel. The MACD BB indicator utilizes the Bollinger Band indicator as well, however in the indicator the average and standard deviation are calculated based on the MACD value as opposed to the market price. This forms a channel around the MACD, as seen in the image below.
In this particular image, the outer bands on both the original MACD BB indicator (pictured in the middle panel) and our improved version (pictured in the bottom panel) are calculated using 1 standard deviation. In Statistics, we learn that 68% of our data set should occur within 1 standard deviations of the mean. However, when we look at the image above, we can see that the original indicator shows the MACD value inside of the bands much less than 68% of the time. In fact, the MACD value is only contained within the bands 40.54% of the time. Our improved version of the indicator keeps the MACD value contained within the bands 72.00% of the time, making it much closer to what statistics teaches us that we should see.
For more information on what makes the calculations more accurate, please refer to my post on Bollinger Bands.
Download Now:
Click the link below to download our Free Improved MACD BB indicator for NinjaTrader 7:
NinjaTrader 7:
Improved MACDBB Indicator for NinjaTrader 7 (6212 downloads)
NinjaTrader 8:
Improved MACDBB Indicator for NinjaTrader 8 (4655 downloads)
View Comments (19)
It doesn't work... do I need to "turn" it on?
Sincerly
Bernie
Can you be more specific as to what is not working? You should not have to "turn" anything on. Are you receiving any error messages when you try to run the indicator?
Would you please create the indicator for Tradestation as well.
Please use the Custom Programming link in the menu to submit custom requests.
What are suggested trade entry setups? I realize past performance is no guarantee of future success or failure of trades.
Mike,
Unfortunately I don't have any suggested entry setups. I was simply sharing what I believe to be an improvement to a fairly popular indicator.
Beautiful work. Thank you for sharing.
This is quite an indicator ! Tremendous Divergence capability. Thanks for posting it.
This indicator is awesome.......
Would it be possible to set up the indicator to produce an audible alert when the dots change colors?
Absolutely. Please visit the Custom Programming link in the menu to submit custom programming requests.
A premium version of this indicator complete with audio and email alerts can be found at this link:
Super MACD BB Indicator for NinjaTrader
Hello, thanks particularly for the interesting idea about correcting stdev() formula. One thing that is not very clear to me how do you apply the modded stdev formula to the macd signal to make macdbb if it does not have high and low like the price bar do? My understanding of the macdbb is that first the macd is calculated then stdev is applied. macd results in 1 value only - so how to apply the modded stdev - a mistery to me.
Second from the picture above comparing original and modded indi - i do not see any difference - apart from the fact that the original uses 3 color scheme to paint in pink the dots inside the BB band - which seems more correct to me than the 2 color scheme modded version.
I am very interested in hearing how do you apply high and low for macd, please ? Thanks.
The standard MacdBB indicator calculates the standard deviation of the Macd value. So the resulting value is representative of how much the Macd value typically changes from bar to bar. The formula for the original indicator is below:
int fast = 12, slow = 26, smooth = 9, bandPeriod = 10;

double numDevs = 1.0;
macd = MACD(Input,fast,slow,smooth);
avg = EMA(macd,bandPeriod);
stdDev = StdDev(macd,bandPeriod);
upperBand = avg[0] + numDevs * stdDev[0];
lowerBand = avg[0] - numDevs * stdDev[0];
The improved version of the indicator performs similar calculations, but instead of looking at the Macd value it looks at the difference between the Macd value and the average. So the resulting values are indicative of the typical trading range above/below the moving average (not on a bar by bar basis). The formula is below:
int fast = 12, slow = 26, smooth = 9, bandPeriod = 10;

double numDevs = 1.0;
macd = MACD(Input,fast,slow,smooth);
avg = SMA(macd,bandPeriod);
double hDiff = macd[0] - avg[0];
double lDiff = avg[0] - macd[0];
diff[0] = Math.Max(hDiff, lDiff);
avgDiff = SMA(diff, bandPeriod);
stdDev = StdDev(diff,bandPeriod);
upperBand = avg[0] + avgDiff + numDevs * stdDev[0];
lowerBand = avg[0] - avgDiff - numDevs * stdDev[0];
In the image, the bands on the improved indicator are slightly wider. If you look at the chart around 14:00, you will see the original MacdBB is plotting outside of the bands, while the improved version of the indicator is plotting inside the bands.
It looks as though the ImpMACDBB, Inside Bar Alerts and Outside Bar Alerts indicators are for NT7. Do you have a different zip file available for the same indicators that works in NT8???
Not yet, but they will be posted in the near future. If you join our mailing list, you will receive updates when they are available.
Any idea on when the NT8 version will be coming out. This version of the indicator is pretty incredible too. Would love to see you combine the benefits of both.
https://forex-station.com/viewtopic.php?f=578489&t=8420990
Sorry, but I don't have a time frame yet. Your link is leading me to an invalid page.