
NinjaTrader Volatility Indicator
Typically in technical analysis, traders will use the Standard Deviation as a measure of volatility. While this tends to be a fairly accurate, there are some flaws in the typical calculations which I have addressed in my NinjaTrader Volatility Indicator.
The first step in calculating the Standard Deviation is to calculate the returns for each bar on the chart. In the typical calculations, this is calculated by taking the closing price of the most recent bar on the chart, and subtracting the closing price of the previous bar (Close[n] – Close[n-1]). The problem with this calculation is that a gap on the chart will cause a dramatic rise in calculation, giving a false indication of increasing volatility. With my NinjaTrader Volatility Indicator, the calculation for returns simply takes the close of the current bar and subtracts the open of the same bar (Close[n]-Open[n]). But I also take the formula one step further and calculate the return as a percentage, which normalizes the values throughout time.
In the image below, I have drawn several lines on the chart to illustrate an example. The first indicator below the price panel in the chart is the Standard Deviation (StdDev). After the gap up on 12/18, we can see that the blue line is clearly indicating an increase in volatility. The indicator below the Standard Deviation shows the Average Range of each bar. With increasing volatility, we would expect that the average range would also be increasing. However as the blue line shows, the average range is rather flat and not increasing. The next indicator we see is the my new Volatility Indicator (mtVolatility), which is actually showing decreasing volatility during this period.
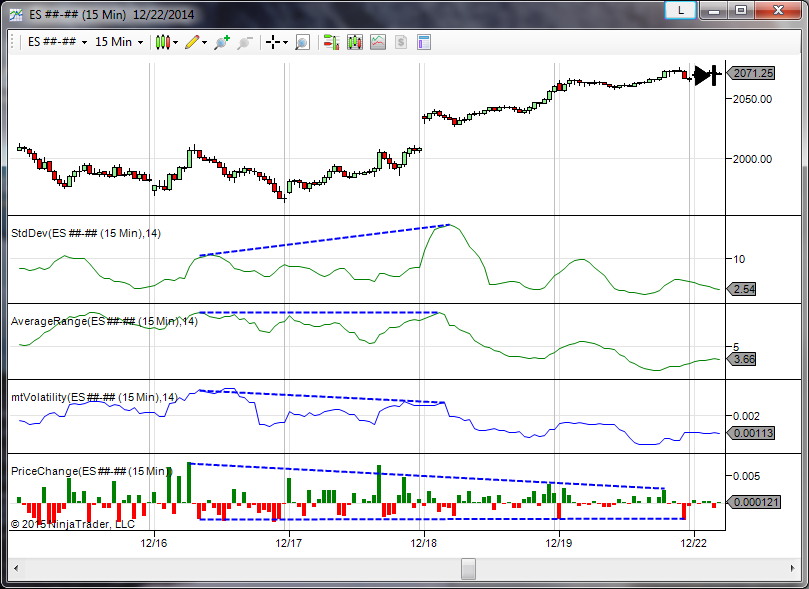 The last indicator on the chart is the Price Change indicator. This indicator is simply displaying the percentage return for each bar (as calculated by my Volatility Indicator). The blue lines drawn on the chart clearly show volatility is clearly decreasing during the time when the Standard Deviation indicator is increasing. However, my volatility indicator correctly shows that volatility is indeed decreasing during the same period.
Click the link below to download a free version of the NinjaTrader Volatility Indicator.
Download Now:
Click the link below to download our Free Volatility indicator for NinjaTrader:
Volatility Indicator for NinjaTrader 7 (2596 downloads)

1 comment
great- don’t trade without it thnx