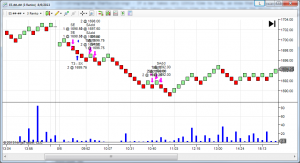
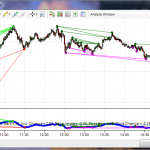
Bar Speed Indicator – For Range Bars, Renko Bars, Tick Bars, Volume Bars and More… The bar speed indicator was created to measure the speed of the current market. When using time based charts such as a 60 minute chart, we can see exactly how far price moves within a given time period. However, with …
Category: Free NinjaTrader Indicators
Browse through our extensive archive of completely free NinjaTrader Indicators below. Feel free to share them with your friends via the Social Media links provided below.
Automatic Fibonacci Retracement Indicator
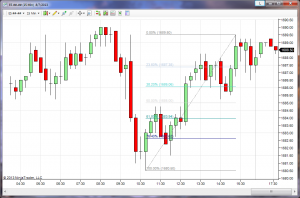
Fibonacci Retracement Indicator A Fibonacci Retracement indicator is often used by traders as an indication of support and resistance. These indicators provide Fibonacci levels that are determined by identifying two extreme points (ex. a swing high and a swing low), and dividing the vertical distance by Fibonacci ratios. Fibonacci Retracement indicators can be used in …
Moving Average Crossover Traders – How to Beat Them
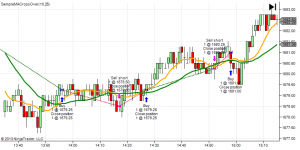
Moving Average Crossovers For many years, futures, fores, and equities traders alike have been using moving average crossovers to determine trends in the market. A very common trading strategy amongst traders is to go long when a faster moving average crosses above a slower moving average, and to go short when the faster moving average …
Fibonacci Based SuperTrend Indicator
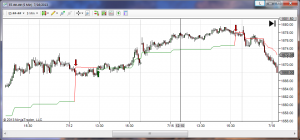
The Fibonacci SuperTrend indicator is based on one of my favorite swing trading strategies to date. While the strategy is fairly simple, the description is a bit lengthy for this post. However, there is a detailed video on the trading strategy by clicking the button below. Swing Trading Video The Original SuperTrend Indicator The …
Free Bollinger Bands – Addressing Inefficiencies With Bollinger Bands
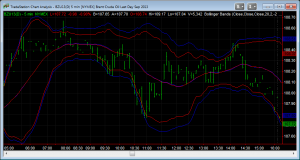
Free Bollinger Bands Indicator for TradeStation and NinjaTrader What makes our free Bollinger Bands indicator better than others? Bollinger Bands are a simple yet effective tool for measuring overbought and oversold (support and resistance) conditions in the markets. Bollinger bands are effective for Futures, Forex, and Equities trading. Typically, Bollinger Bands will plot a channel …
Point And Figure Price Action Indicator
Point And Figure Price Action Indicator Point and Figure is a charting technique used to determine trends in the market. Point and Figure charting can be used in Futures, Forex, and Equities trading. This Point and Figure based Price Action indicator for NinjaTrader includes the following features: Optional Arrows to show when the trend has …
- 1
- 2

