Opening Range Breakout – Larry Williams, Toby Crabel, and Sheldon Knight Methods
The Opening Range Breakout is a very common trading strategy that has been around for many years. In over a decade of trading, it is one of the very few daytrading strategies that I have found to be fairly consistent. An article I read on Futures Magazine’s Web site discusses several variations of the Opening Range Breakout strategy, including those of Larry Williams, Toby Crabel, and Sheldon Knight. You can find the article at:
Opening Range Breakout: Past, present, and future
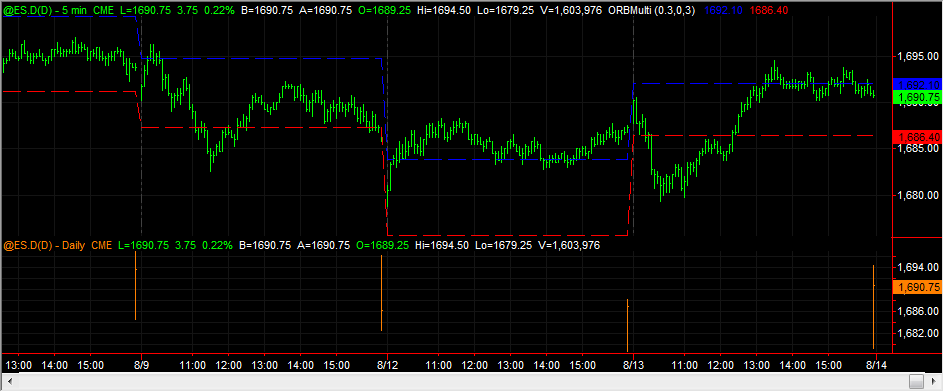
The article claims that Larry Williams was able to turn $10,000 into over $1 million in less than 1 year. Below is a link to download a TradeStation Indicator based on the code provided in the article above. It will allow you to plot the Opening Range Breakout values using any of the 3 methods. The code was designed to work with 2 data streams on the chart, the first being an intraday chart and the second being a daily chart.
Download Now:
Click the link below to download our Free Opening Range Breakout indicator for TradeStation:
Opening Range Breakout Indicator for TradeStation (5286 downloads)
View Comments (18)
Is this Opening Range BreakOut indicator not available for NinjaTrader ?
Unfortunately I do not have it coded for NinjaTrader at the moment.
Thanks for sharing this valuable indicator. I have installed it but cannot get it to function on a 5 min NQ chart. I have selected the indicator in format mode on the chart a couple of times to make certain it is "on" but it will not remain on.
Foolow up to my question...the error message that I did find reads "ORBMulti is missing Data 2. Please setup your chart data..."
Not sure about this as all of the other indicators are working fine. I have created a chart with the symbol @NQH14 and no other indicators just to see if there is a conflict but with no luck there.
Doug,
You will need to add a second data series to your chart. To do so, right click the chart and select Insert Symbol. The symbol you insert will determine the time-frame used to calculate the Opening Range High and Low values.
Tried adding the same symbol or SPY. In each case it puts another chart in the window at the bottom but the indicator still remains turned off with nothing displayed. Sorry. Your other two Tradestation files loaded just fine.
The indicator seems to be working fine on my end. Please see the images at the links below for the proper settings.
http://screencast.com/t/R0ySvy5v4LJ
http://screencast.com/t/8wLpYyjZfnA
thats what was needed. Thank you.
trying to insert teh OR indicator but i am getting an events log message reading "ORBMulti is missing Data 2. Please set up your chart data"; cant seem to figure out what i need to do. Any suggestions?
Roxy,
It sounds like you need to insert the secondary data series on your chart (right click the chart and select 'Insert Symbol').
got the indicator on chart (followed instructions above) as insert symbol but then keeps turning the ORBMulti status off wen i click it to on and close format analysis technique it turns it back to off so blue and red lines dotted are not showing up on chart
my chart and insert symbol screens same as in jing screen captures but red and blue dotted lines not showing up at top of 5 min chart.
event summary message reads " Chart Analysis Status has been turned off. Change the keyword that is used or the ........" when i turn stats to on under format analysis technique then clos it forces staus back to off.
can some one please reply?
Hi, do you have any plan in the near future to have this indicator for Ninja Trader?
I will likely create a version for NinjaTrader at some point in the future, but I do not have any plans at this time.
I just downloaded your opening range indicator (ORBMuliti) for TS. When I tried to use it I got an error code in the Events log. It said ....ORBMuliti is missing Data 2. please set up your chart data. I am not sure what this means. Can you suggest how to proceed.
You need to add a secondary data series to your chart. Right click your chart and select "Insert Symbol". Then add a chart of the same symbol but with a higher time frame (i.e. 5 minutes if your original chart is 1 minute).