A very common request I receive for custom indicators and strategies is to include divergence. While divergence is easy for the eyes to see, it can be quite difficult to define in terms that are programmable. The Divergence Indicator for NinjaTrader utilizes a sophisticated algorithm to detect divergence, and eliminates some shortcomings of typical divergence indicators. It can be calculated using ANY indicator that you have in NinjaTrader (ex. RSI, MACD, Stochastic, or any custom indicators).
What is Divergence?
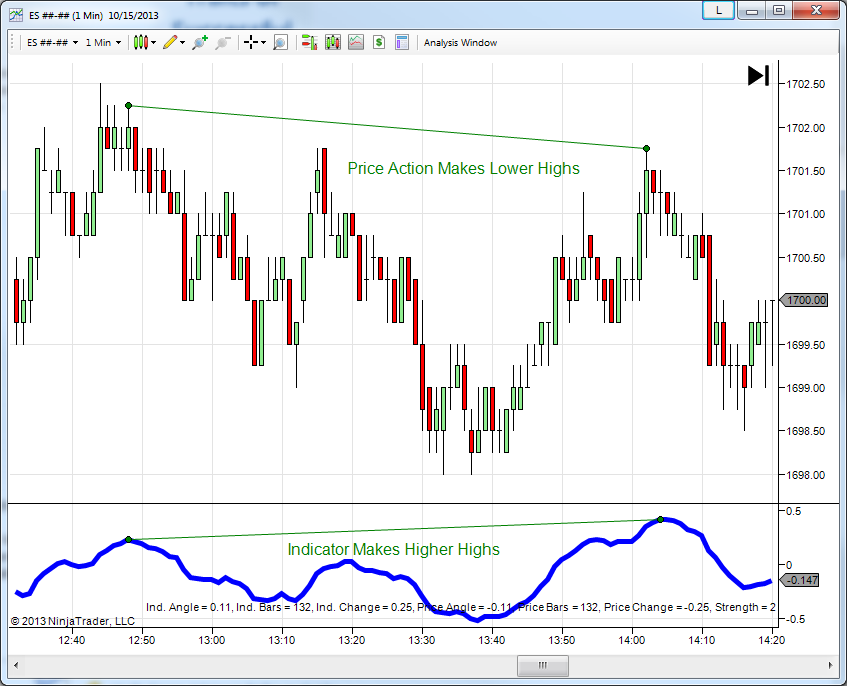
The simple definition of divergence is when price is moving in the opposite direction of a given indicator. Typically divergence is calculated using an oscillator type of indicator. Some common indicators used to detect divergence include the MACD, RSI, and Stochastic indicators. The image below shows an example of divergence using the MACD indicator, which is the blue line at the bottom of the chart. The indicator has drawn lines on the price chart connecting lower highs in price. Similarly, the indicator has drawn a line on the MACD chart connecting higher highs. Since price is making lower highs, and the indicator is making higher highs, we have divergence!
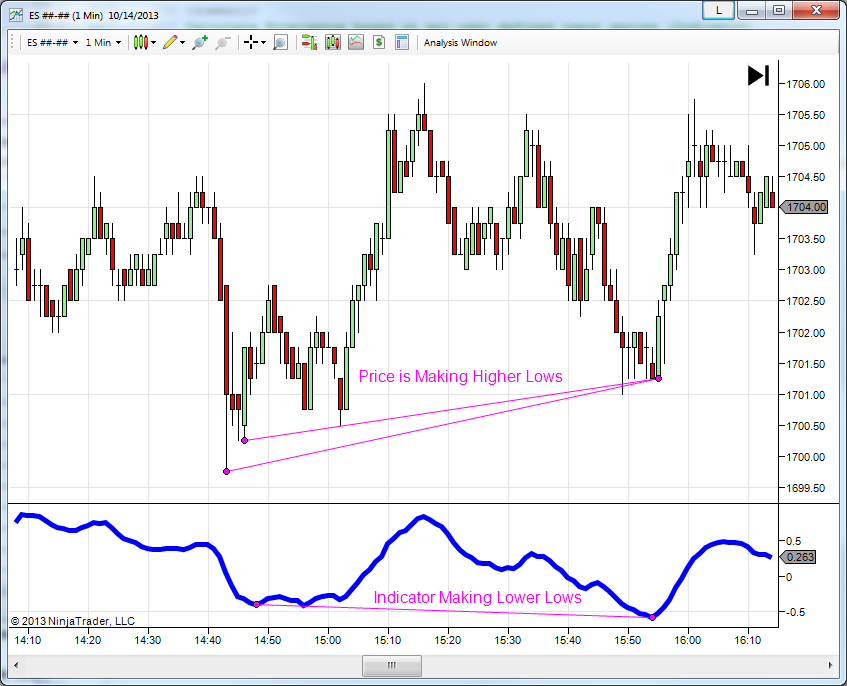
Here is another example of divergence, where price is making higher lows and the indicator is making lower lows.
There are 4 possible scenarios that we can use to find divergence:
Regular Divergence
- Price is making higher highs while indicator is making lower highs
- Price is making lower lows while indicator is making higher lows
Hidden Divergence
- Price is making lower highs while indicator is making higher highs
- Price is making higher lows while indicator is making lower lows
The Divergence Indicator for NinjaTrader will detect all types of divergence listed above, and plot color coded lines to allow you to easily identify different types of divergence.
Additional Features
- Typical Divergence Indicator’s have a delay of several bars before identifying a divergence pattern. The delay in this indicator is limited to 1 bar!
- Will calculate based on ANY indicator you have in NinjaTrader (ex. RSI, MACD, or any custom indicator)
- Filters allow you to easily identify which types of divergences generate the best trading opportunities
- Email and Audio alert notification of new divergence signals
- Customizable Plots
- And More…
No other products compare when it comes to detecting and analyzing divergence patterns in NinjaTrader!
How To Purchase
Purchase a LIFETIME LICENSE for only $199.95. Simply enter your NinjaTrader Machine ID and use the appropriate button below. NO REFUNDS, ALL SALES ARE FINAL!
Available for NinjaTrader 7 and NinjaTrader 8
Purchase for NT7 |
Purchase for NT8 |
Users Guide
Click the button below to download the users guide for the Divergence Indicator.
NinjaTrader Divergence Indicator User’s Guide
Additional Information
If you would like more information about our Divergence Indicator for NinjaTrader, please email me at info@mooretechllc.com.
Save
Save
Save
View Comments (61)
You say "this week only" lifetime licence. Is that for that indicator or ,does that mean all future indicators?
It is a lifetime license for this indicator only. At the moment, all of the other indicators on the site are completely free.
Is the divergence indicator available for Tradestation?
Unfortunately the divergence indicator is not available for TradeStation at this time. I am hoping to have this available in the next month or so.
I would like to know if your divergence indicator will recognize and be able to plot divergences with price with the "Gomi CD" - Cumulative delta indicator- it is a custom widely available indicator that many people have for ninja. Thanks -
I have not tried the divergence indicator with the Gomi CD indicator, but as long as the Gomi CD indicator is exposing the values it should work without any issues.
Hi there, I am interested in this indicator. Do you offer any trial before I commit to buy? Cheers!
There is no free trial available for the indicator.
It has been quite a while since you mentioned the 7 day money back guarantee, Does it still apply?
There is no 7 day money back guarantee. All sales are final.
That's too bad about the guarantee. I have a Stochastics Indicator but in one up or down swing, it will produce 15 or 20 signals to the point of making them useless. I need significant swing highs and lows. Is your algorithm any more discriminating?
Yes. This indicator contains filters that will allow you to reduce the number of signals. You can read more about the filters in the Users Guide at http://www.mooretechllc.net/Downloads/NinjaTrader/DivergenceIndicatorUsersGuide.pdf
Can this be set to give divergence signals on multiple MA's at once? Can it give signals as simple arrows on the chart? I use other indicators and this would obscure things way too much.
The indicator can give signals on multiple indicators at once, but you will have to put multiple instances of the indicator on your chart to do so. The indicator will not currently identify the signals using simple arrows, but if you visit the custom programming link in the menu the indicator can be modified to do so.
Can I reference the indicator in a strategy to automatically execute trades?
Yes you can
Hi!
You can say what systems you have here for Ninja?
And see the performance before?
Thnaks
I do not have any systems. Only indicators.
hi, will be this indicator deliver for ninjatrader 8?
The indicator is not currently compatible with NinjaTrader 8, but it will be in the near future.
I notice in the above examples that when price makes an equal high or equal low (double top or double bottom) and there's divergence in the indicator, your divergence indicator does not flag it as divergence. Can your indicator be configured to look for these double tops and bottoms?
Also, with NinjaTrader 8 being released soon, will you offer a free upgrade to your divergence indicator so that it will be compatible with Ninja's new platform?
The indicator will detect divergences on double tops and double bottoms. There will be an upgrade to the NinjaTrader 8 version soon, but I do not yet have details on pricing.
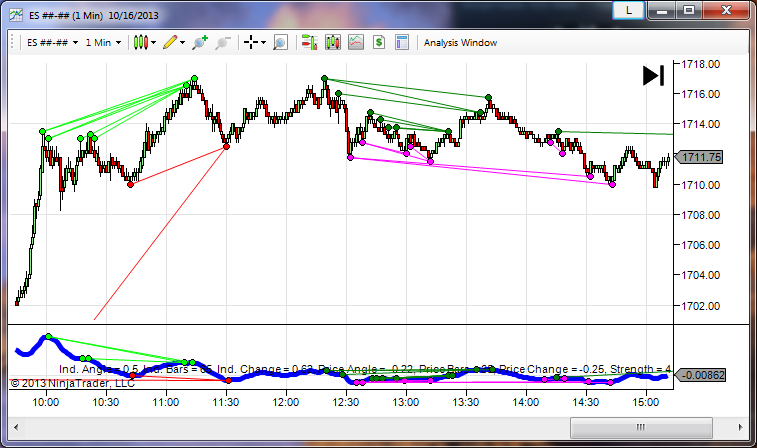
Thanks for the quick reply. In your first chart above (the ES on 10/16/2013) there's a double top between the high at 11:13 and the high at 12:20 but your divergence indicator is not showing the bearish divergence - is this something that can be corrected in the settings of the indicator?
I apologize but I misspoke in my prior reply. The indicator will not detect divergences on double tops and double bottoms. As long as there is at least 1 tick difference in the prices, it will detect divergences.
Thanks for the clarification. If you can code double top and double bottom divergences into your NinjaTrader 8 version (or even NT7), please contact me - I'll be a happy customer!
The indicator has been modified to detect divergences on double tops and double bottoms.
is it possible with the NT8 ver. of the indicator to filter and to show divergences ONLY when they are occurring , with a + - offset, either at a double top, or at a double bottom, or at a given meaningful level, (for example at a horizontal line, or at a naked POC, evolving POC, or prior day VAH, prior day VAL, evovlving VAH, evolving VAL, prior day high or low, current day high or low, .... )
Unfortunately, that is not possible with the indicator.
Can this divergence detector be used in market analyzer for scanning the market?
Yes. The indicator will output one of five values to the market analyzer window to determine if there is no divergence, bullish hidden, bullish regular, bearish hidden, or bearish regular divergence.