Fibonacci Extension Indicator
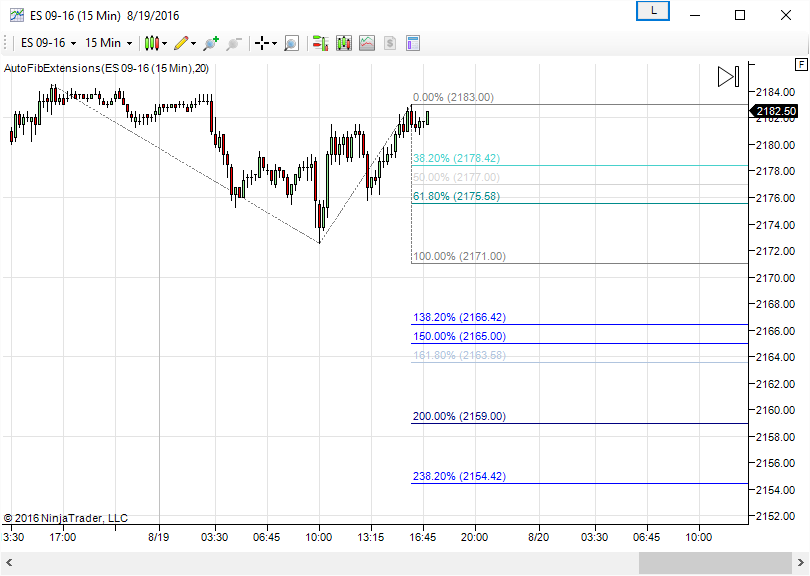
A Fibonacci Extension indicator is often used by traders as an indication of support and resistance. These indicators provide Fibonacci levels that are determined by identifying three extreme points (ex. a swing low, a swing high, and a swing low), and dividing the vertical distance between the first two extreme points by Fibonacci ratios. The resulting values are then added/subtracted from the third extreme point to show the Fibonacci Extension levels.
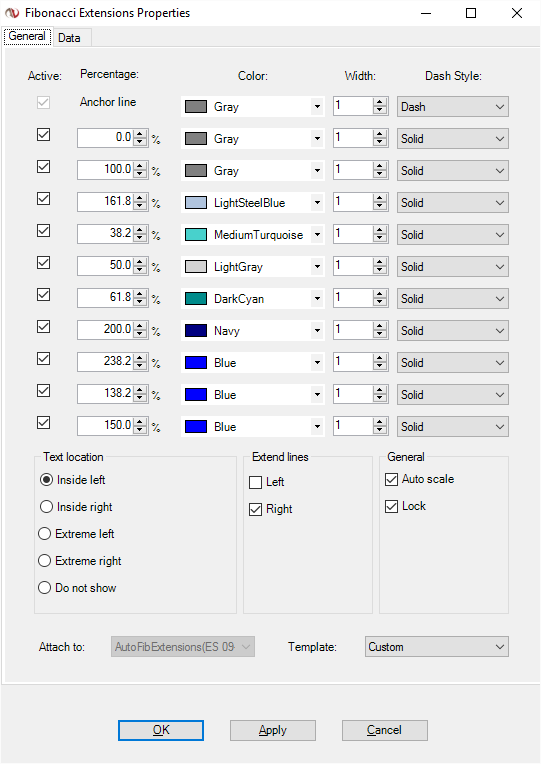
The Fibonacci Extension indicator will automatically find new swing high and low points, and update the Fibonacci Extension levels on your charts for you. This makes it easy for you to spot potential trading opportunities and act accordingly. Additionally, the indicator allows you to easily customize which extension levels are displayed, as well as the color, width, and style of the lines. You can also save and load templates, making it easy to switch between the settings that work best with your trading.
Download Now:
Click the link below to download our Free Automatic Fibonacci Extension indicator for NinjaTrader:
Auto Fibonacci Extensions Indicator for NinjaTrader 7 (7848 downloads)
View Comments (12)
This indicator is for NinjaTrader 8?
We do not currently have the indicator for NinjaTrader 8, but it is coming soon. Join our mailing list and you will be notified as soon as it is available.
any updates for ninjatrader 8???
The indicator is not ready for NinjaTrader 8 yet. The update will be posted as soon as it is available.
Is this available for tradestation?
Hi Jim,
Unfortunately I do not have this available for TradeStation at this time. I will see if I can put together a TradeStation version in the near future.
Once the Auto Fib Extensions Indicator is installed, where do I find the Properties, General and Data tabs, as noted above?
You should be able to right click on the gray line and select Properties from the menu.
What does the strength parameter represent?
The strength represents the number of bars used in the calculation of a pivot high or pivot low. If you are using a value of 20 for the strength, the market must make a 20 bar high for it to be considered a pivot high.
Is this available for NT8 yet?
Unfortunately not. I am hoping to have all of the indicators compatible with NT8 by the end of the year.