What it does
Consecutive Bars Counter gives traders a signed streak count for up-closing and down-closing bars. It is useful when you want a quick read on short-term persistence, exhaustion, or compression without building a more complicated momentum study.
Who this is for
This page is a good fit for traders who want a readable Consecutive Bars Counter workflow without having to reverse-engineer the setup from forum posts or screenshots.
Key terms for this tool
Review the core trading and platform terms tied to this page before changing settings or using the study in a live workspace.
What it is not
Consecutive Bars Counter is a chart-context tool. It does not place trades, manage risk automatically, or promise that a specific pattern will resolve in one direction. Use it to organize decisions, not to outsource them.
Chart examples
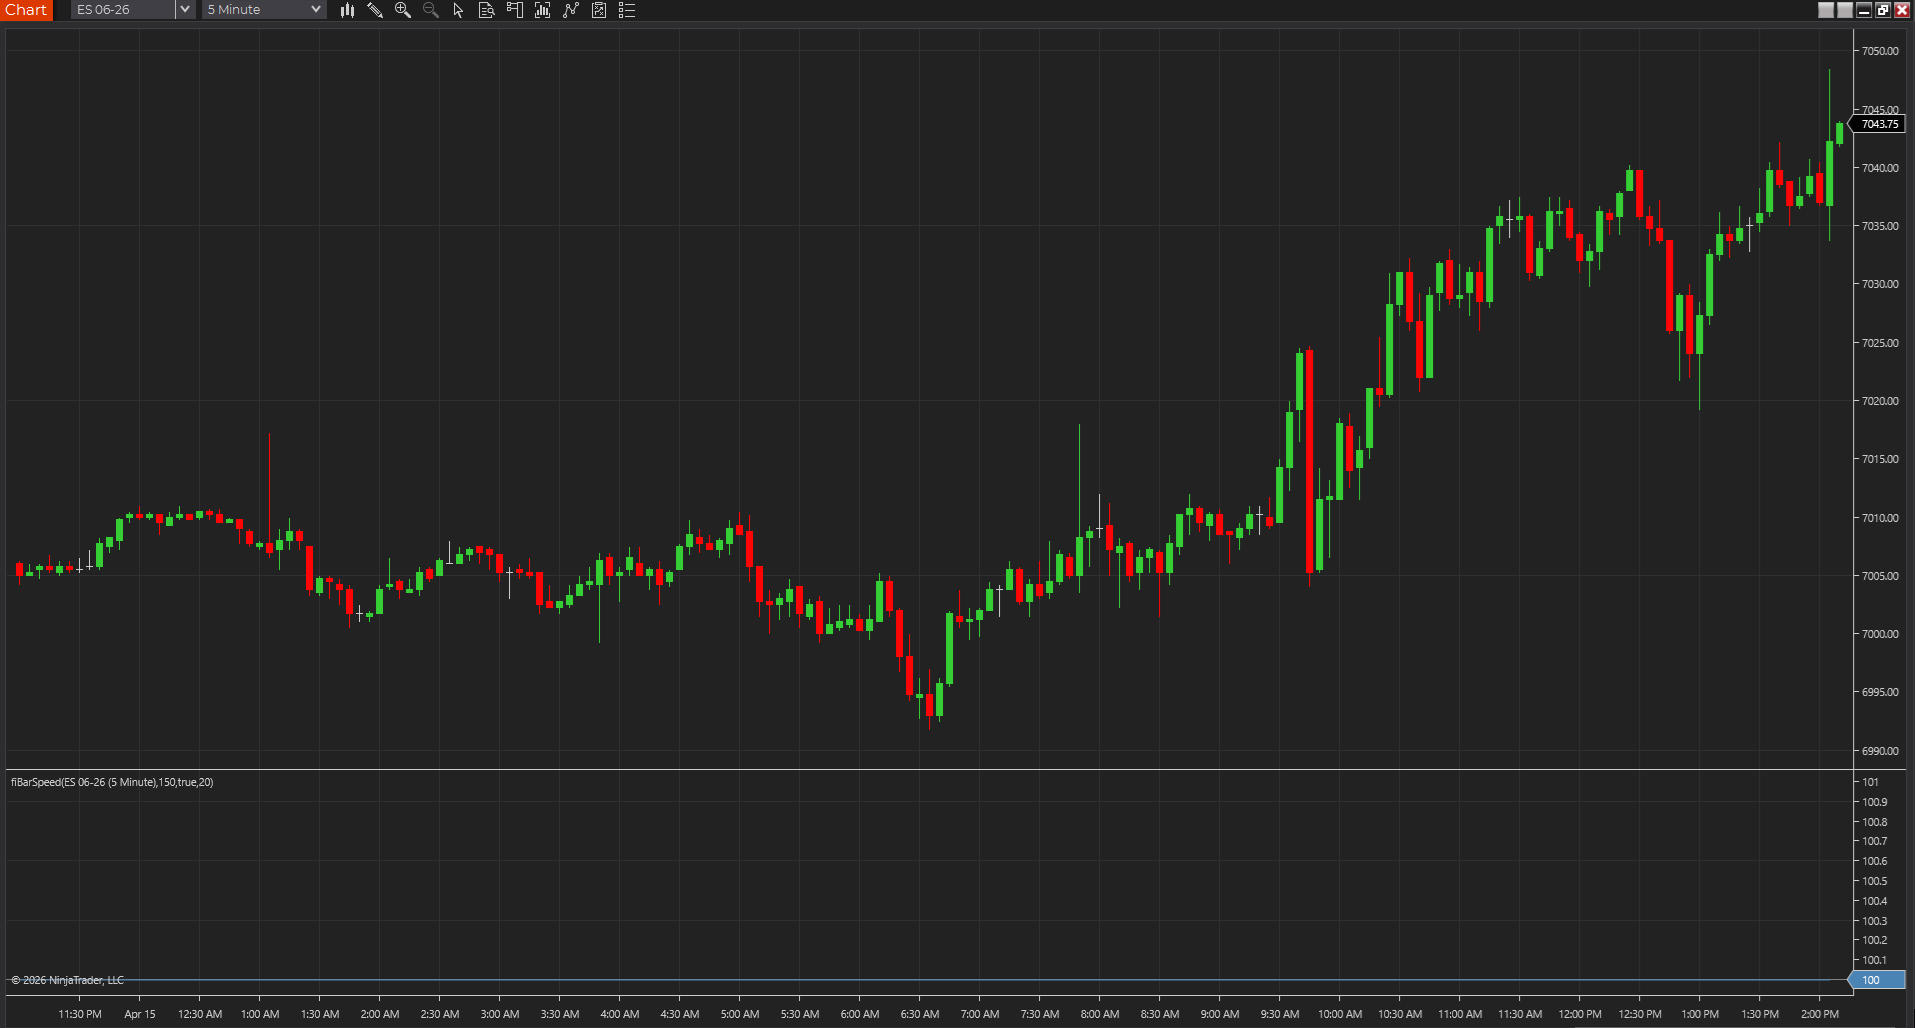
This chart capture shows the study on a real NinjaTrader workspace. Use it as visual reference, then confirm behavior on your own instrument, session, and timeframe.
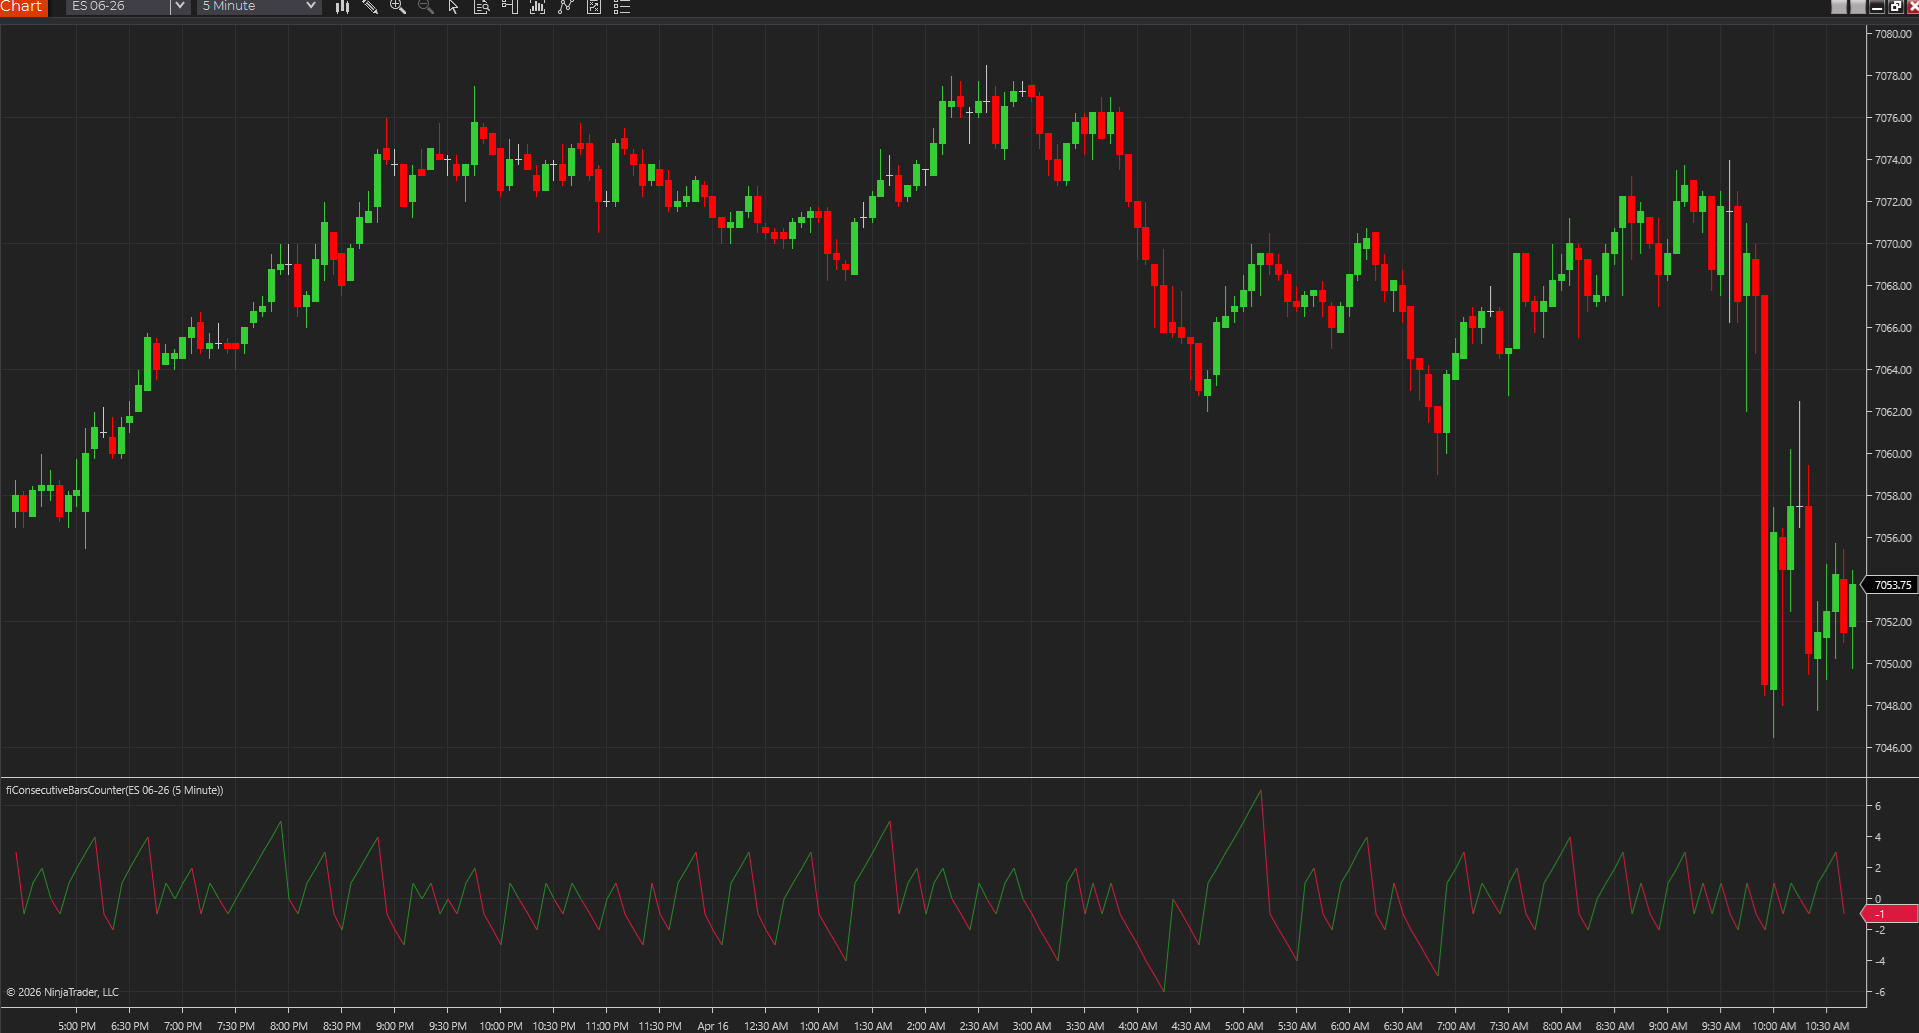
Bar streak count on chart
A NinjaTrader 8 chart capture showing Consecutive Bars Counter tracking directional bar sequences directly on price.
Best fit
- Tracking short-term directional persistence.
- Spotting overextended bar sequences before they become obvious by eye.
- Adding a simple streak measure to a price-action workflow.
Before using it live
- Import the NinjaTrader 8 ZIP through NinjaTrader's normal import flow.
- Use it in a separate panel so the signed streak count is easy to read.
- Test it on the chart type you actually trade because streak behavior varies by bar style.
- Review how the tool behaves on your actual session template, chart type, and instrument.
Settings to review
Sets the color used for positive streak values.
Sets the color used for negative streak values.
Read it as a signed streak count rather than a signal line.
Installation notes
- Import the NinjaTrader 8 ZIP through NinjaTrader's normal import flow.
- Use it in a separate panel so the signed streak count is easy to read.
- Test it on the chart type you actually trade because streak behavior varies by bar style.
Downloads
Source code
These source examples are provided for copy/paste workflows on other charting platforms. Review and test any script in a simulator before using it on a live chart.
{
  Consecutive Bars Counter
  FreeIndicators.com source example.
  Works as a starting point for TradeStation EasyLanguage and MultiCharts PowerLanguage.
}

Vars: Streak(0);

If Close > Close[1] Then
  Streak = IFF(Streak >= 0, Streak + 1, 1)
Else If Close < Close[1] Then
  Streak = IFF(Streak <= 0, Streak - 1, -1)
Else
  Streak = 0;

Plot1(Streak, "Streak");// Consecutive Bars Counter
// FreeIndicators.com source example for MetaTrader 4.
#property indicator_chart_window
#property indicator_buffers 3
#property indicator_color1 DodgerBlue
#property indicator_color2 Crimson
#property indicator_color3 SeaGreen
double Buffer1[];
double Buffer2[];
double Buffer3[];
int init() {
SetIndexBuffer(0, Buffer1);
SetIndexBuffer(1, Buffer2);
SetIndexBuffer(2, Buffer3);
return(0);
}
int start() {
int counted = IndicatorCounted();
int limit = Bars - counted - 1;
double streak = 0;
for(int i = limit; i >= 0; i--) {
if(Close[i] > Close[i + 1]) streak = streak >= 0 ? streak + 1 : 1;
else if(Close[i] < Close[i + 1]) streak = streak <= 0 ? streak - 1 : -1;
else streak = 0;
Buffer1[i] = streak;
}
return(0);
}// Consecutive Bars Counter
// FreeIndicators.com source example for MetaTrader 5.
#property indicator_chart_window
#property indicator_buffers 3
#property indicator_plots 3
double Buffer1[];
double Buffer2[];
double Buffer3[];
int OnInit() {
SetIndexBuffer(0, Buffer1, INDICATOR_DATA);
SetIndexBuffer(1, Buffer2, INDICATOR_DATA);
SetIndexBuffer(2, Buffer3, INDICATOR_DATA);
return(INIT_SUCCEEDED);
}
int OnCalculate(const int rates_total,
const int prev_calculated,
const datetime &time[],
const double &open[],
const double &high[],
const double &low[],
const double &close[],
const long &tick_volume[],
const long &volume[],
const int &spread[]) {
int start = prev_calculated > 1 ? prev_calculated - 1 : 1;
double streak = 0;
for(int i = start; i < rates_total; i++) {
if(close[i] > close[i - 1]) streak = streak >= 0 ? streak + 1 : 1;
else if(close[i] < close[i - 1]) streak = streak <= 0 ? streak - 1 : -1;
else streak = 0;
Buffer1[i] = streak;
}
return(rates_total);
}//@version=5
indicator("Consecutive Bars Counter", overlay=true)
var float streak = 0
if close > close[1]
streak := streak >= 0 ? streak + 1 : 1
else if close < close[1]
streak := streak <= 0 ? streak - 1 : -1
else
streak := 0
plot(streak, "Streak", color=streak >= 0 ? color.green : color.red, style=plot.style_columns)Limitations
- A long streak can keep extending longer than expected.
- The count ignores volume and volatility context.
- Different chart types can change how quickly streaks build.
Frequently asked questions
Does it repaint?
This indicator is designed as a chart reference tool, not as a hindsight-only backfitted signal. Even so, you should still test it bar by bar on your chart type to confirm how it behaves on the active bar.
Which platforms are covered?
NinjaTrader 8, TradeStation EasyLanguage, MultiCharts PowerLanguage, MetaTrader 4, MetaTrader 5, TradingView Pine Script are currently represented through downloads or source pages.
Is source code included?
Yes. This page includes source examples or links to platform-specific source pages where applicable.