A practical shortlist of free trading indicators that already have real download files, chart screenshots, and usable page support instead of vague writeups with nowhere to click next.
9 min readSupporting guide5 related tools5 chart screenshots
Read guide
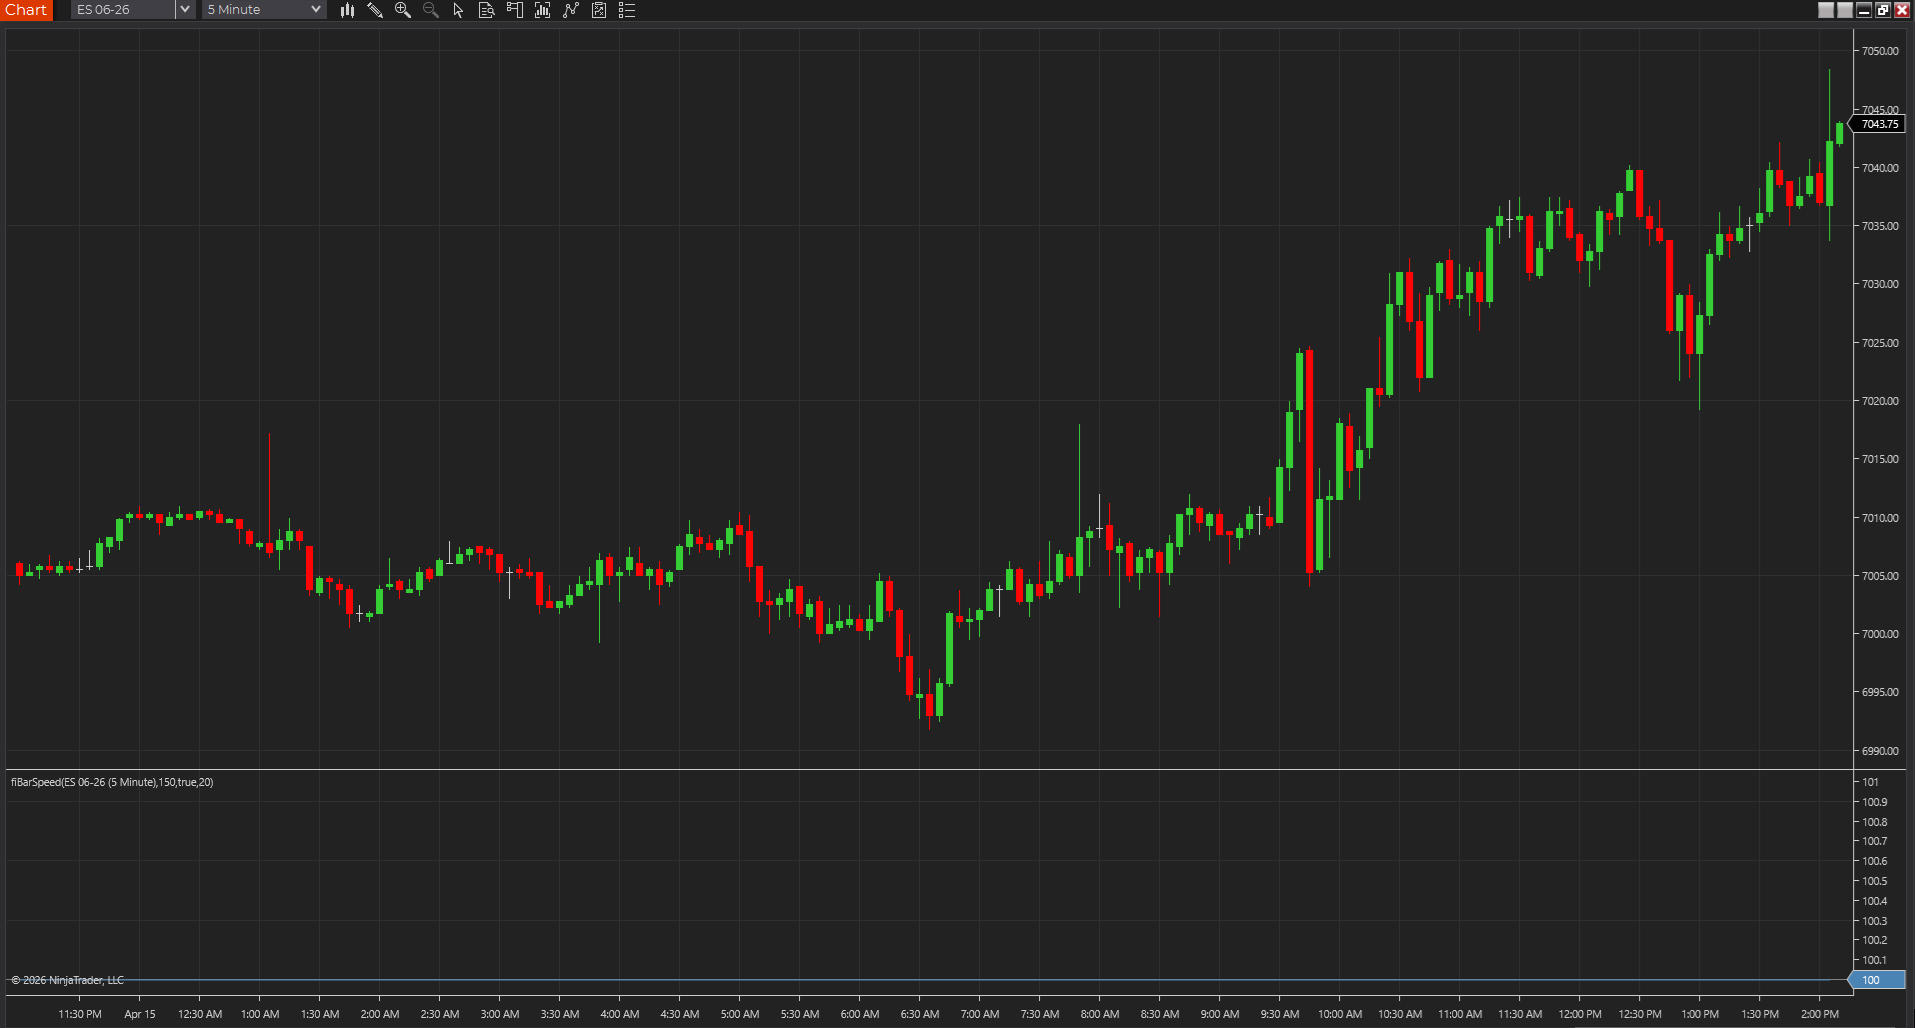
Bar tempo on a live chartA chart capture showing how Bar Speed keeps changing participation tempo visible while price rotates and expands.
A practical guide to the indicator pages that already include source-backed logic or platform source pages, so traders can inspect, port, or adapt the tool instead of treating it like a black box.
8 min readSupporting guide4 related tools4 chart screenshots
Read guide
Clean chart structure at a glanceA broader chart image for guides about chart reading, platform workflow, and price-action context.
A practical guide to the three main kinds of indicator pages traders run into, and why using the wrong expectation on the wrong page creates confusion fast.
6 min readSupporting guideWorkflow articleExplainer format
Read guide
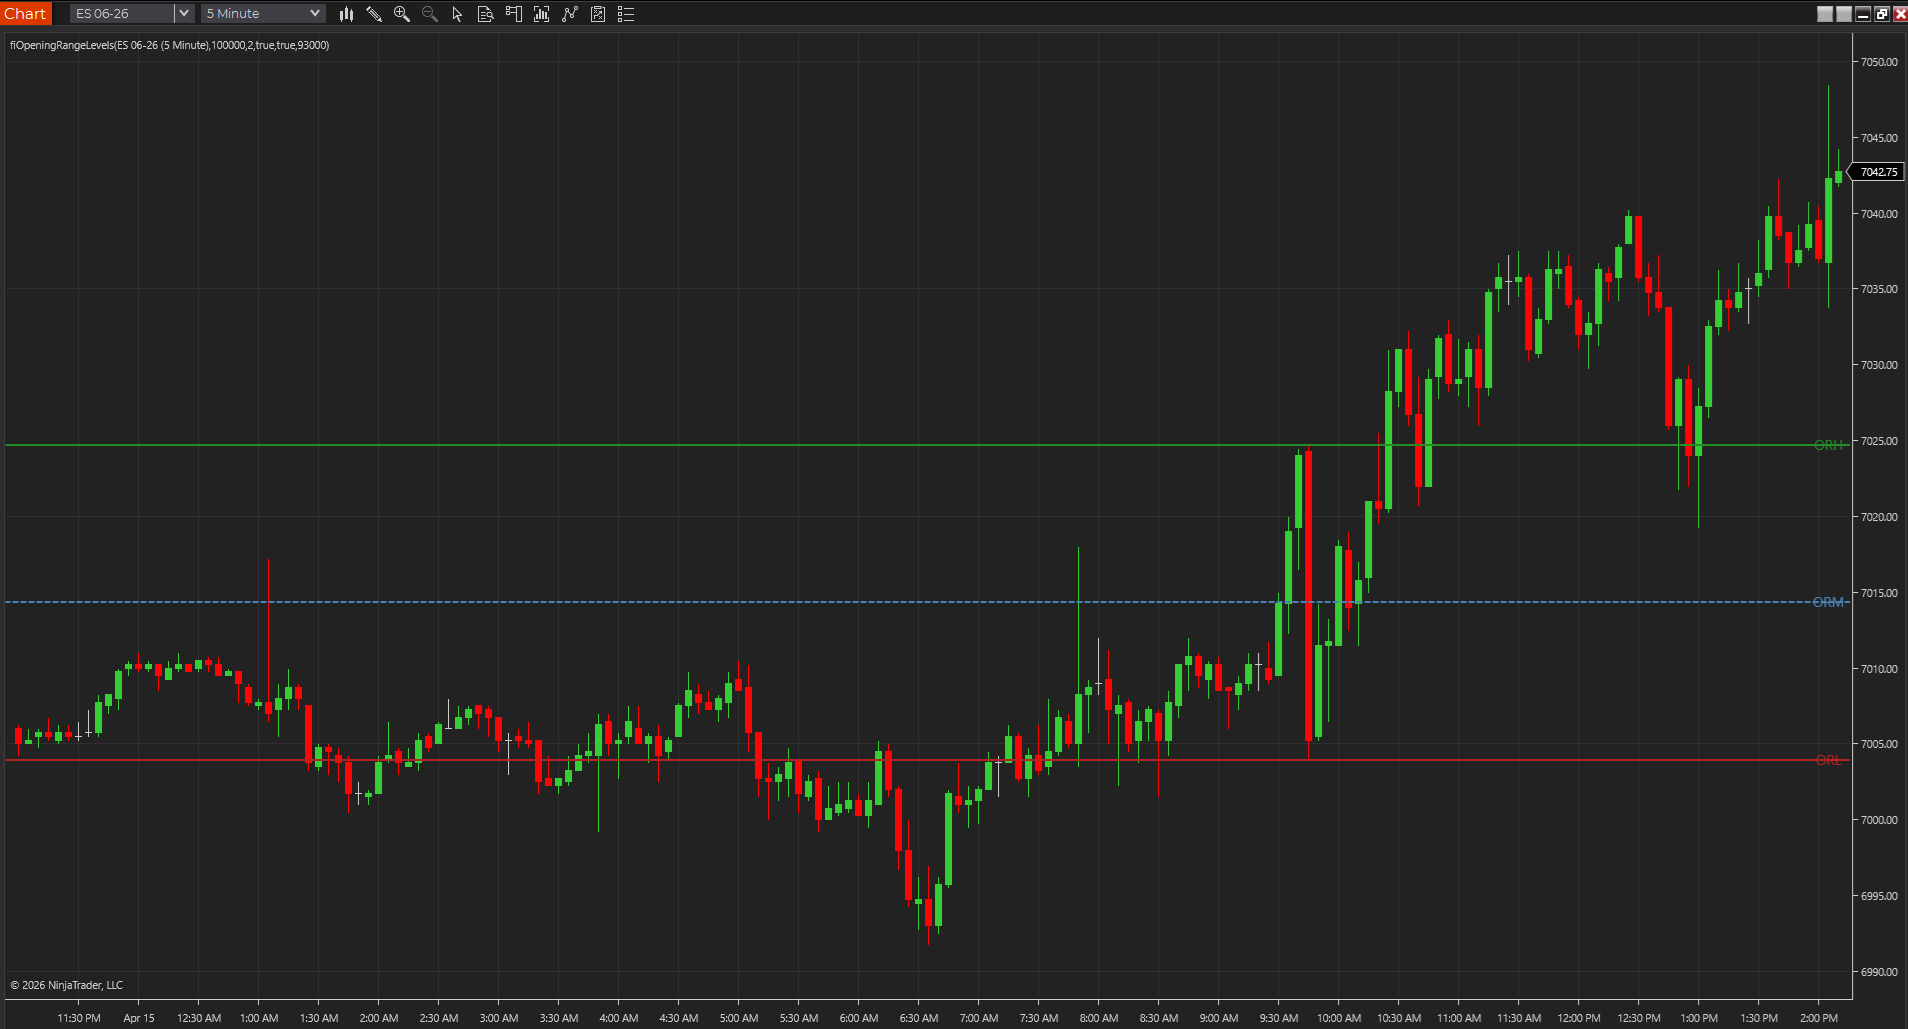
Opening range mapped on chartA chart showing the opening range high, low, and midpoint held on screen for early-session context.
A practical guide to building a simple futures-open chart with just enough structure, participation, and risk context to make fast decisions without turning the screen into indicator soup.
8 min readSupporting guide5 related tools5 chart screenshots
Read guide
Opening range mapped on chartA chart showing the opening range high, low, and midpoint held on screen for early-session context.
A practical guide to testing trading indicators in market replay without giving them perfect hindsight, false confidence, or credit for decisions they did not really help with.
8 min readSupporting guide4 related tools4 chart screenshots
Read guide
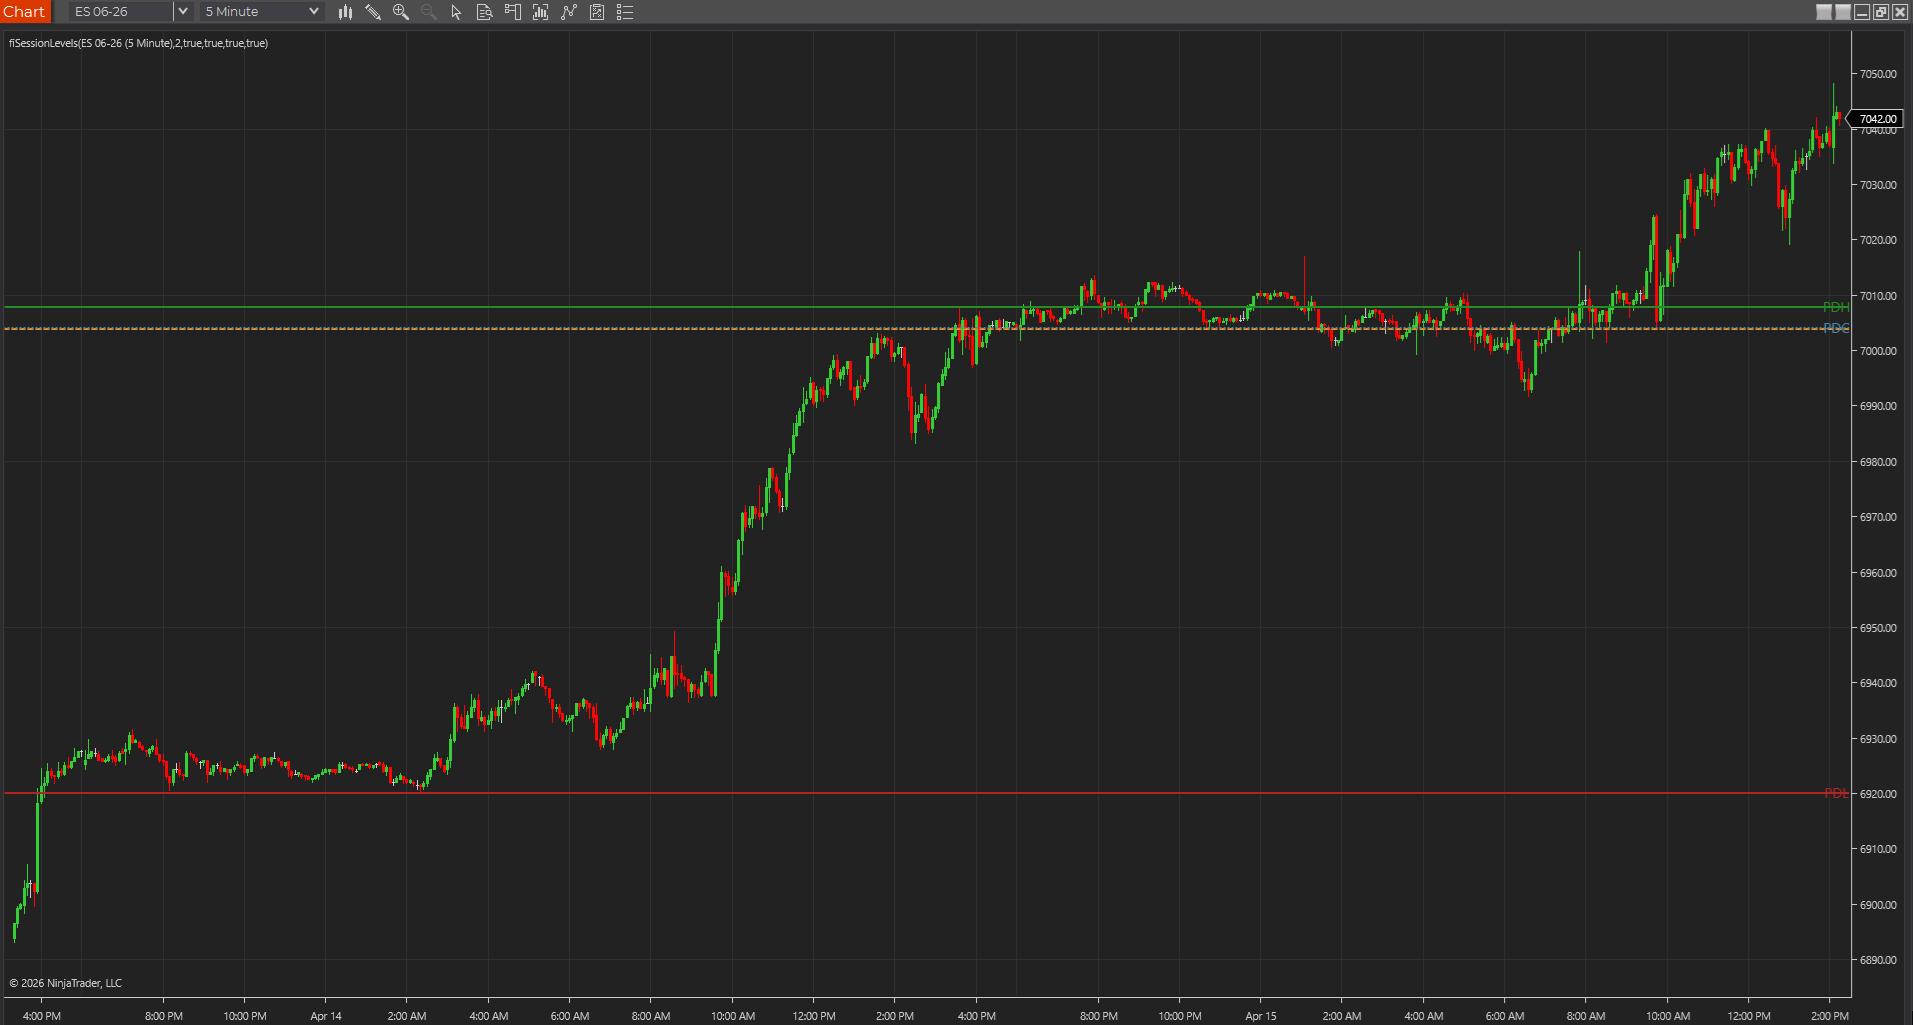
Prior-session references on chartA chart showing session reference lines such as prior levels and the session open held in view during live trade.
A practical cleanup guide for traders whose futures charts have become so crowded with levels, signals, and overlays that the indicator stack is making decisions harder instead of easier.
7 min readSupporting guide4 related tools4 chart screenshots
Read guide
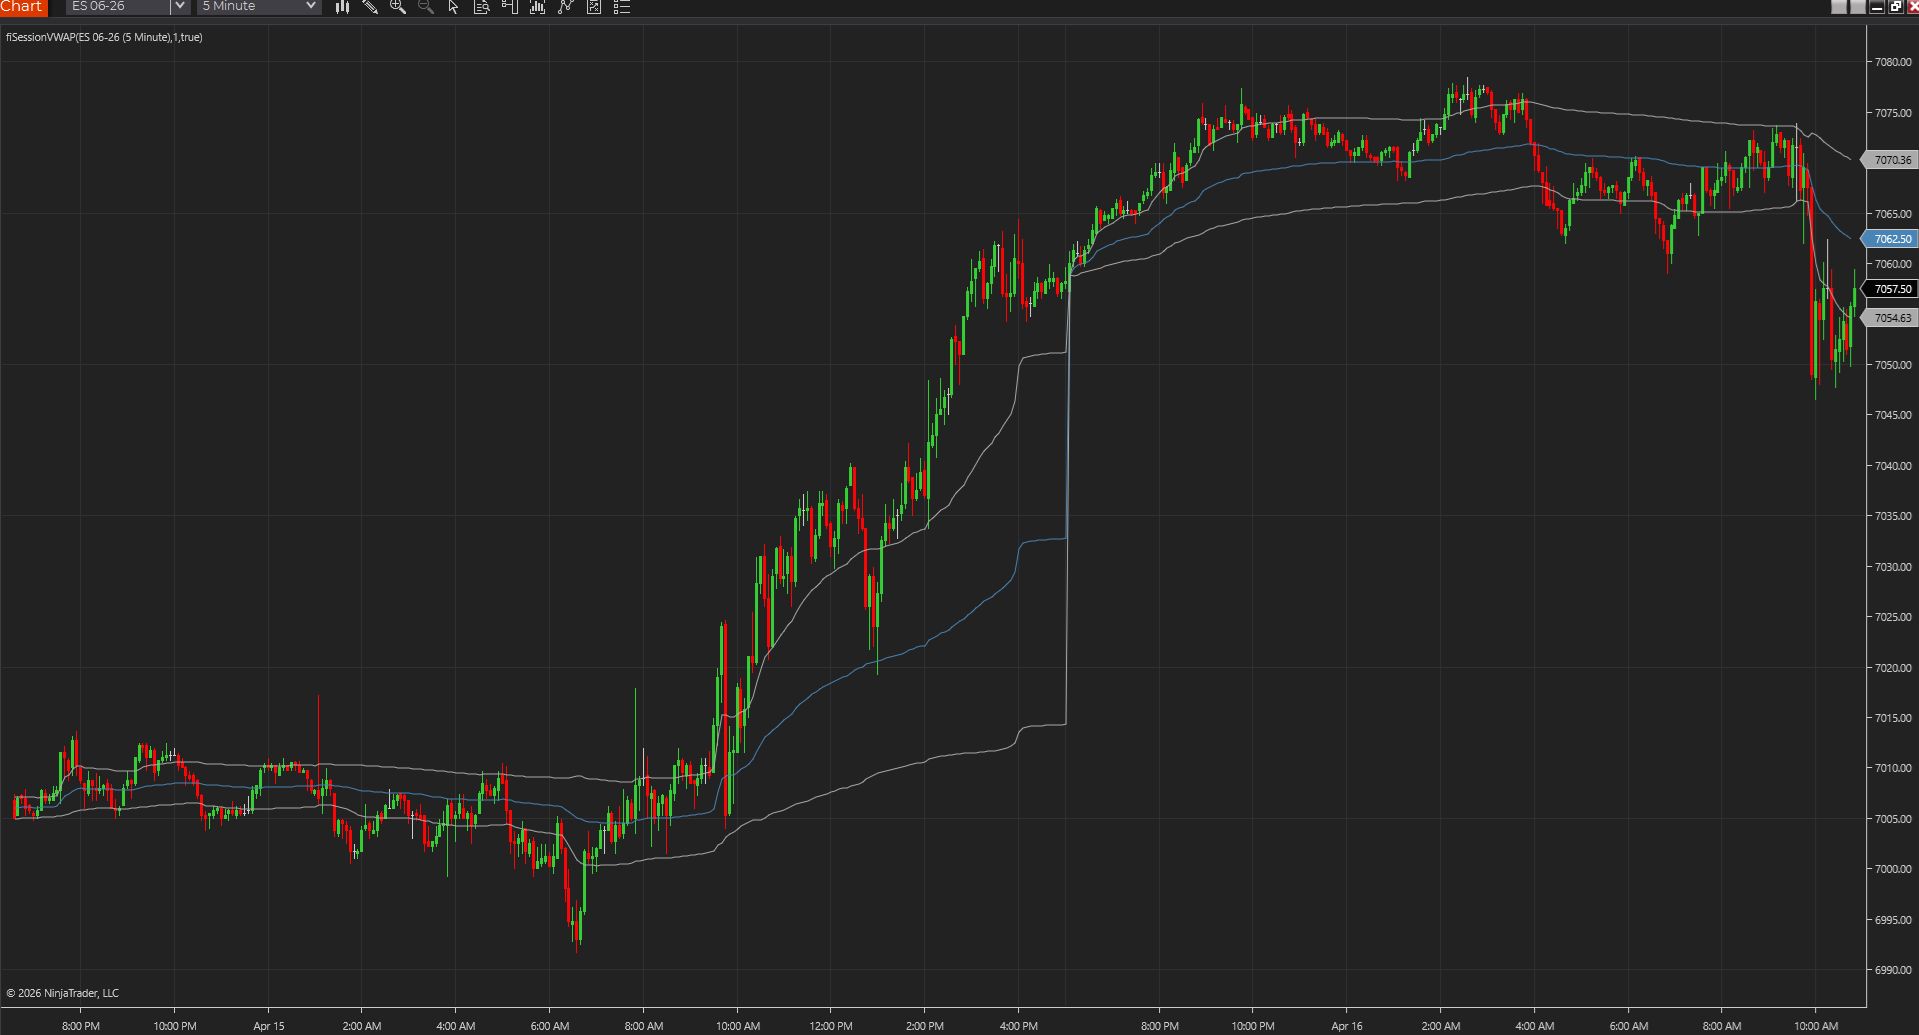
Session VWAP on a live chartA chart capture showing Session VWAP anchored to the trading day for intraday fair-value context.
A practical framework for traders who want a simple futures workflow that can survive the jump between NinjaTrader, TradingView, TradeStation, MetaTrader, or MultiCharts without losing its logic.
9 min readSupporting guide4 related tools4 chart screenshots
Read guide
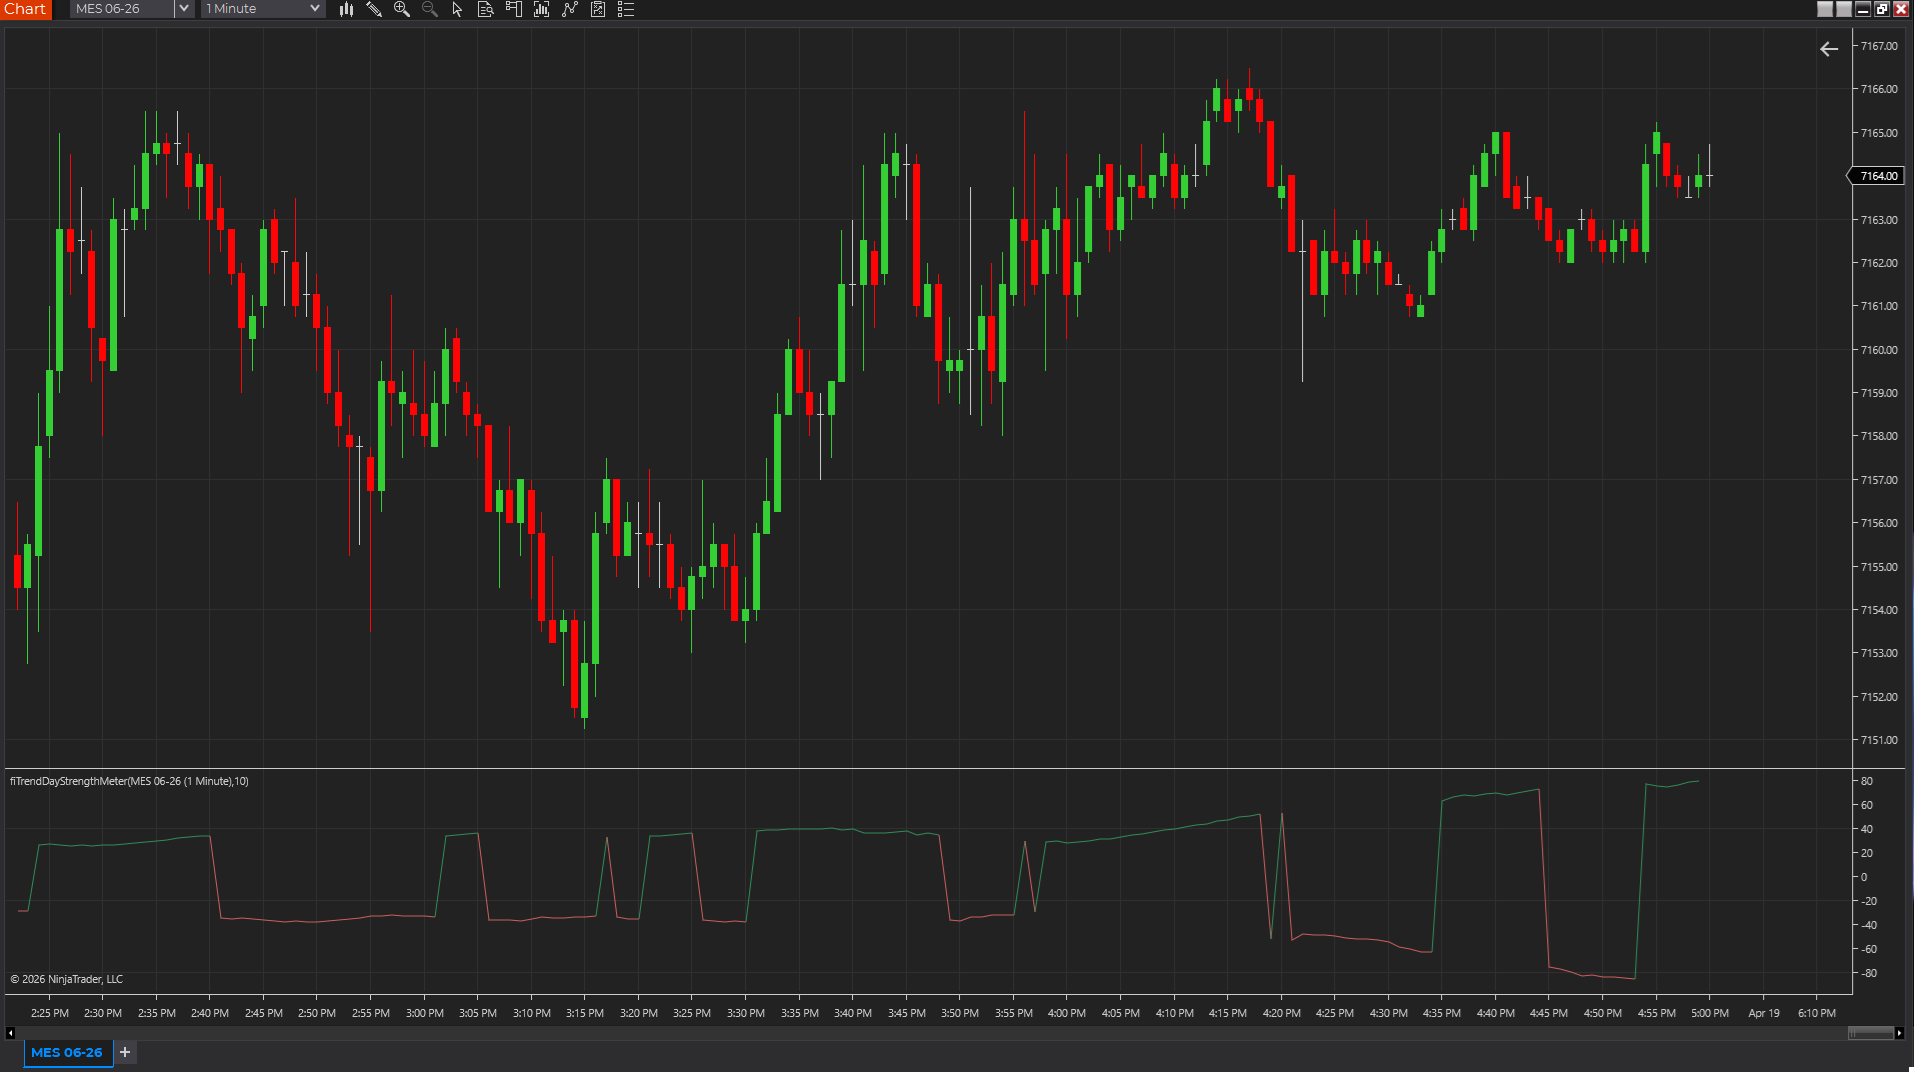
Trend-day pressure meterA chart showing Trend Day Strength Meter scoring session-open extension and persistence in a lower panel.
A practical workflow guide for building a futures trend-day chart that stays focused on direction, pullback quality, and risk instead of piling on indicators that all say the same thing.
8 min readSupporting guide4 related tools4 chart screenshots
Read guide
Session VWAP on a live chartA chart capture showing Session VWAP anchored to the trading day for intraday fair-value context.
A practical guide to building a futures range-day chart that helps traders frame balance, failed breakouts, and location without mistaking every small move for the start of a trend.
8 min readSupporting guide4 related tools4 chart screenshots
Read guide
Opening range mapped on chartA chart showing the opening range high, low, and midpoint held on screen for early-session context.
A practical futures workflow guide for traders who care most about confirming whether a breakout has enough structure, participation, and follow-through to deserve attention.
8 min readSupporting guide4 related tools4 chart screenshots
Read guide
Prior-session references on chartA chart showing session reference lines such as prior levels and the session open held in view during live trade.
A futures-first shortlist of NinjaTrader indicators for traders who need cleaner session context, participation cues, structure, and risk framing instead of a crowded chart.
9 min readSupporting guide4 related tools4 chart screenshots
Read guide
Opening range mapped on chartA chart showing the opening range high, low, and midpoint held on screen for early-session context.
A futures-focused comparison of session VWAP and anchored VWAP, including when each one gives the cleaner read on fair value, event-driven context, and session structure.
8 min readSupporting guide3 related tools3 chart screenshots
Read guide
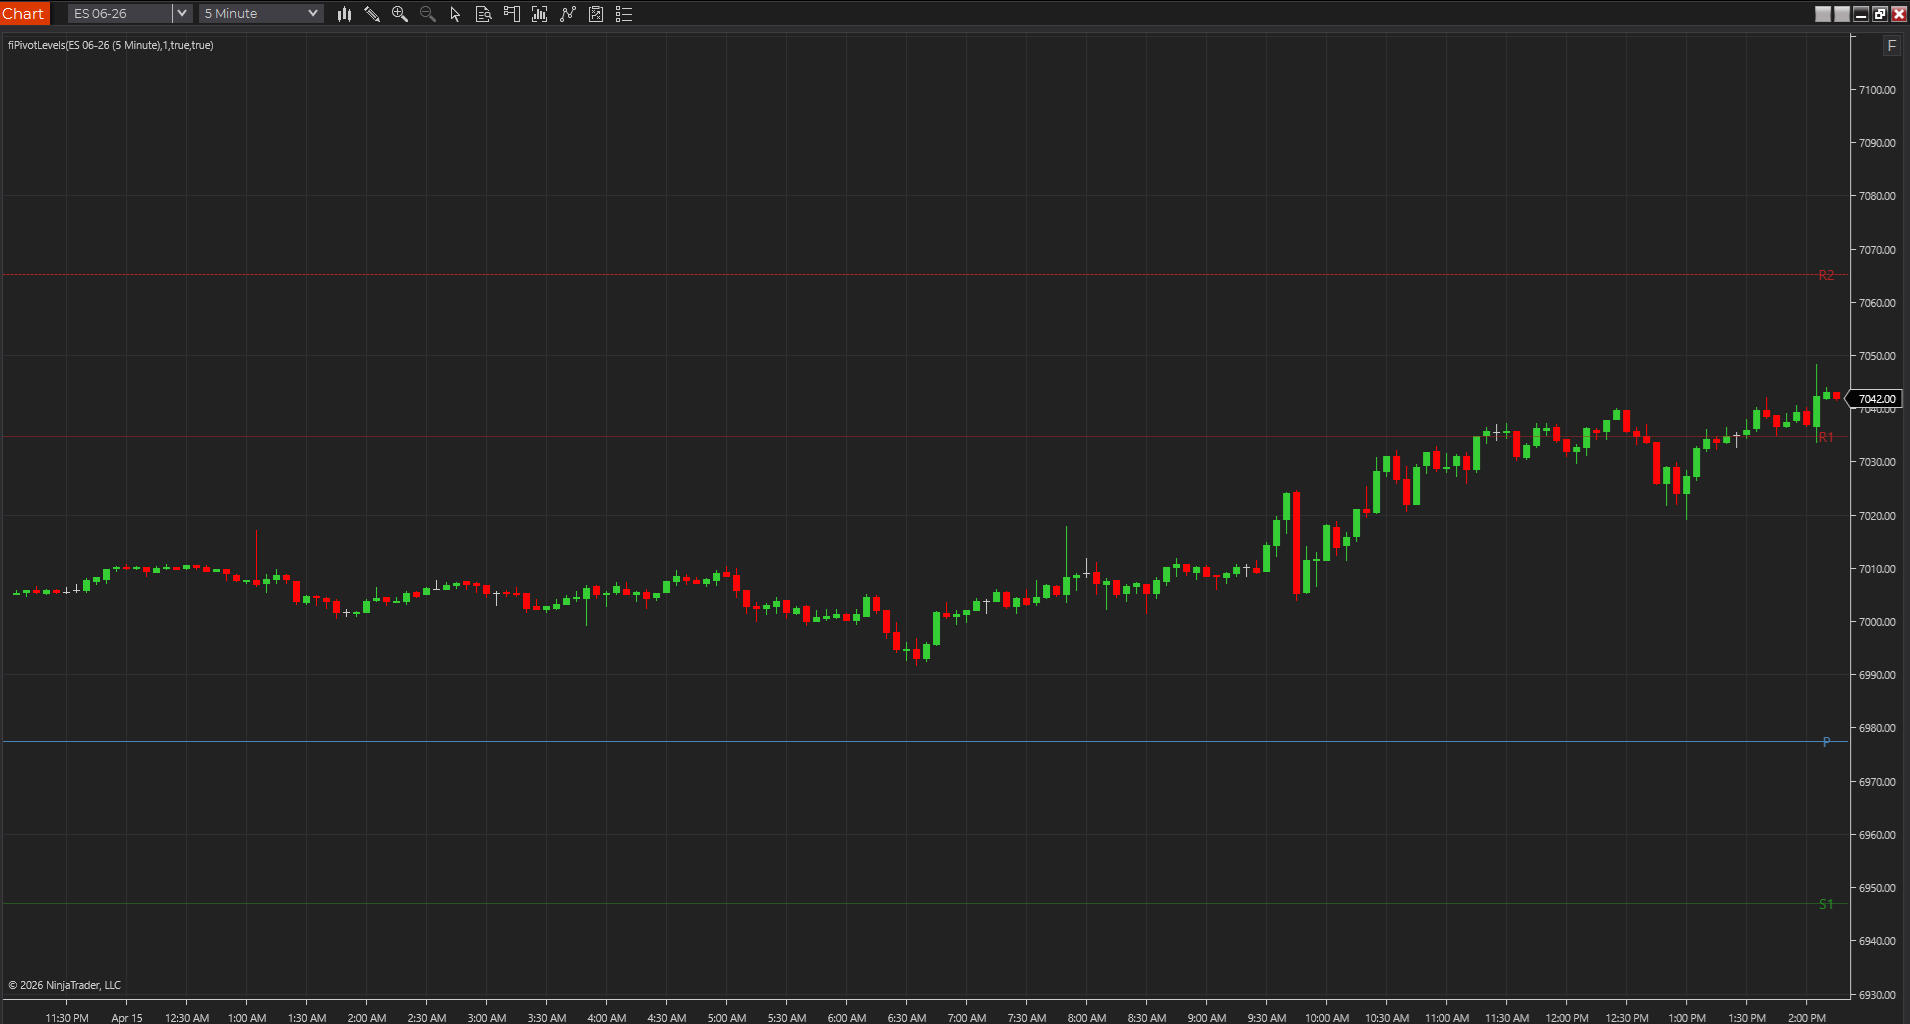
Pivot map on a live sessionA chart showing the classic pivot framework with session-derived support and resistance levels already on screen.
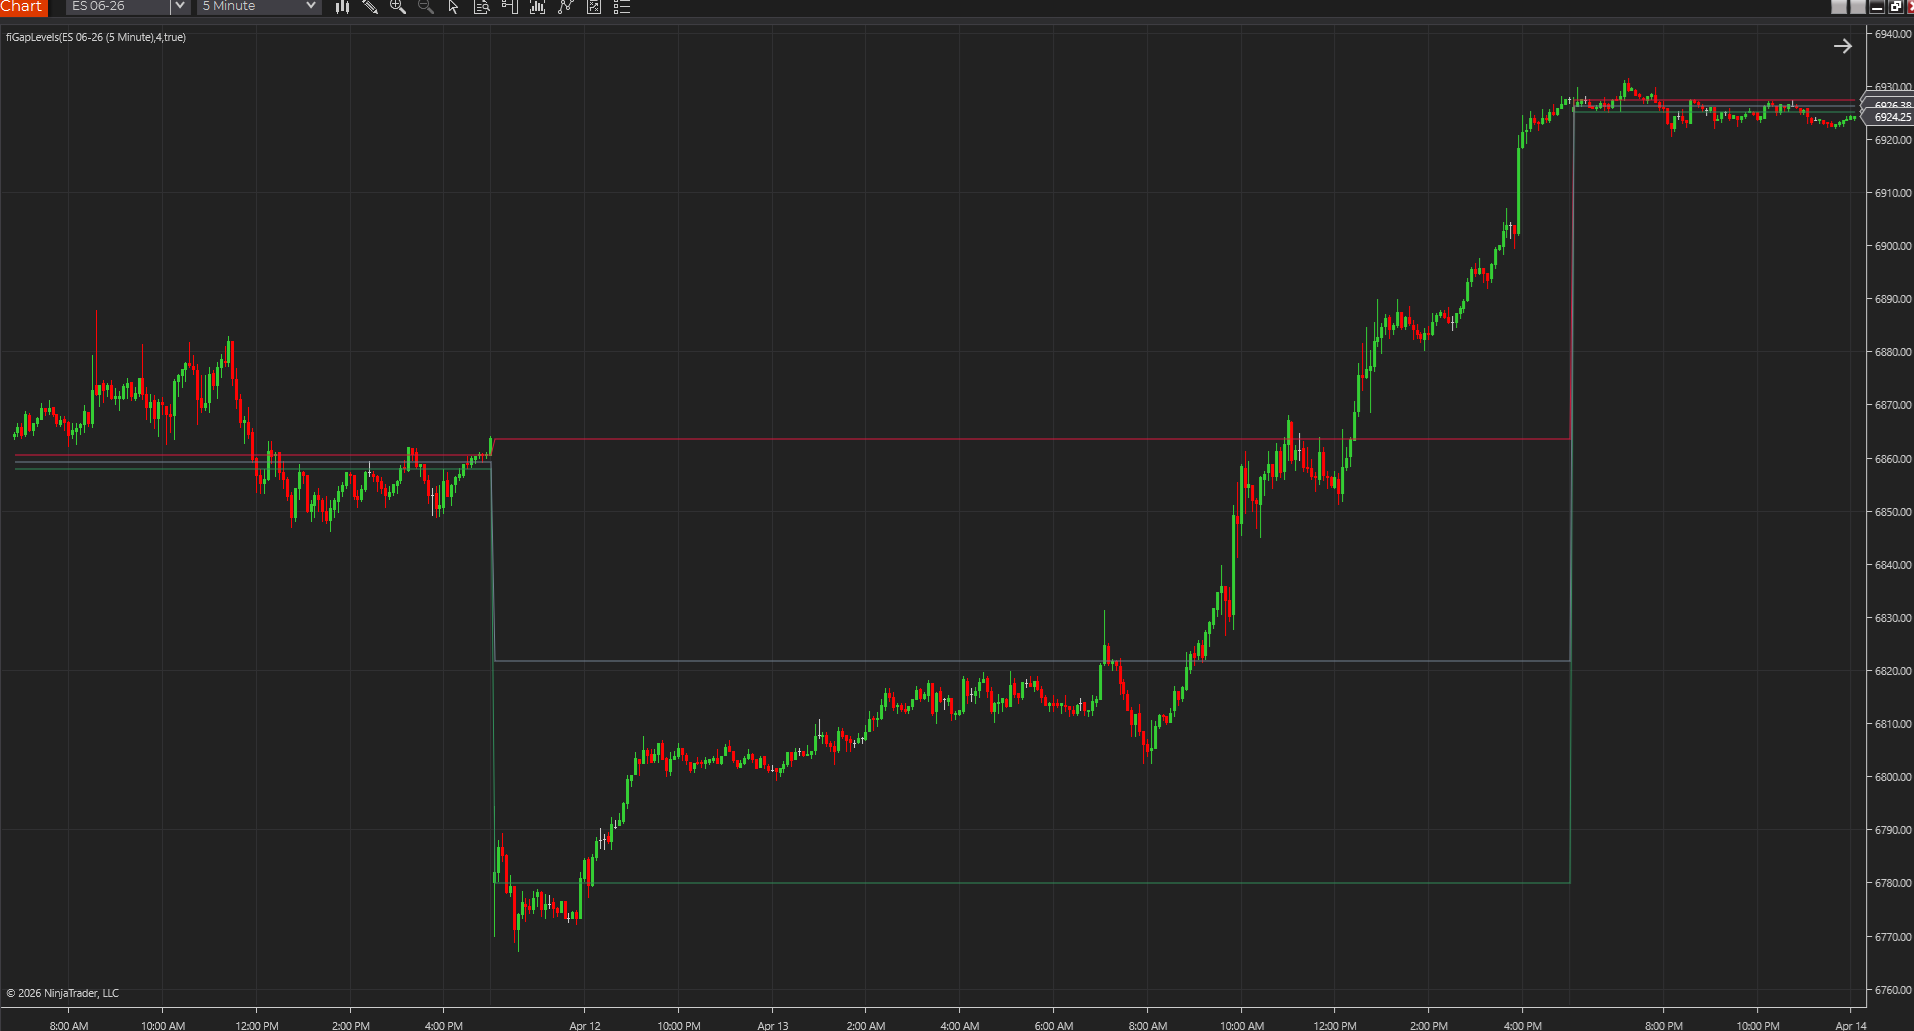
A direct comparison of gap levels and prior-session levels for futures traders deciding whether the overnight separation or the prior auction map deserves more weight.
8 min readSupporting guide3 related tools3 chart screenshots
Read guide
Prior-session references on chartA chart showing session reference lines such as prior levels and the session open held in view during live trade.
A practical workflow for combining session levels, pivots, gaps, and a few higher-time-frame references without turning a futures chart into a maze of lines.
9 min readSupporting guide4 related tools4 chart screenshots
Read guide
Bar tempo on a live chartA chart capture showing how Bar Speed keeps changing participation tempo visible while price rotates and expands.
A practical guide to the best TradingView indicators for structure, trend, session context, and participation when you care more about usable Pine scripts than marketplace hype.
Platform guideSupporting guide4 related tools4 chart screenshots
Read guide
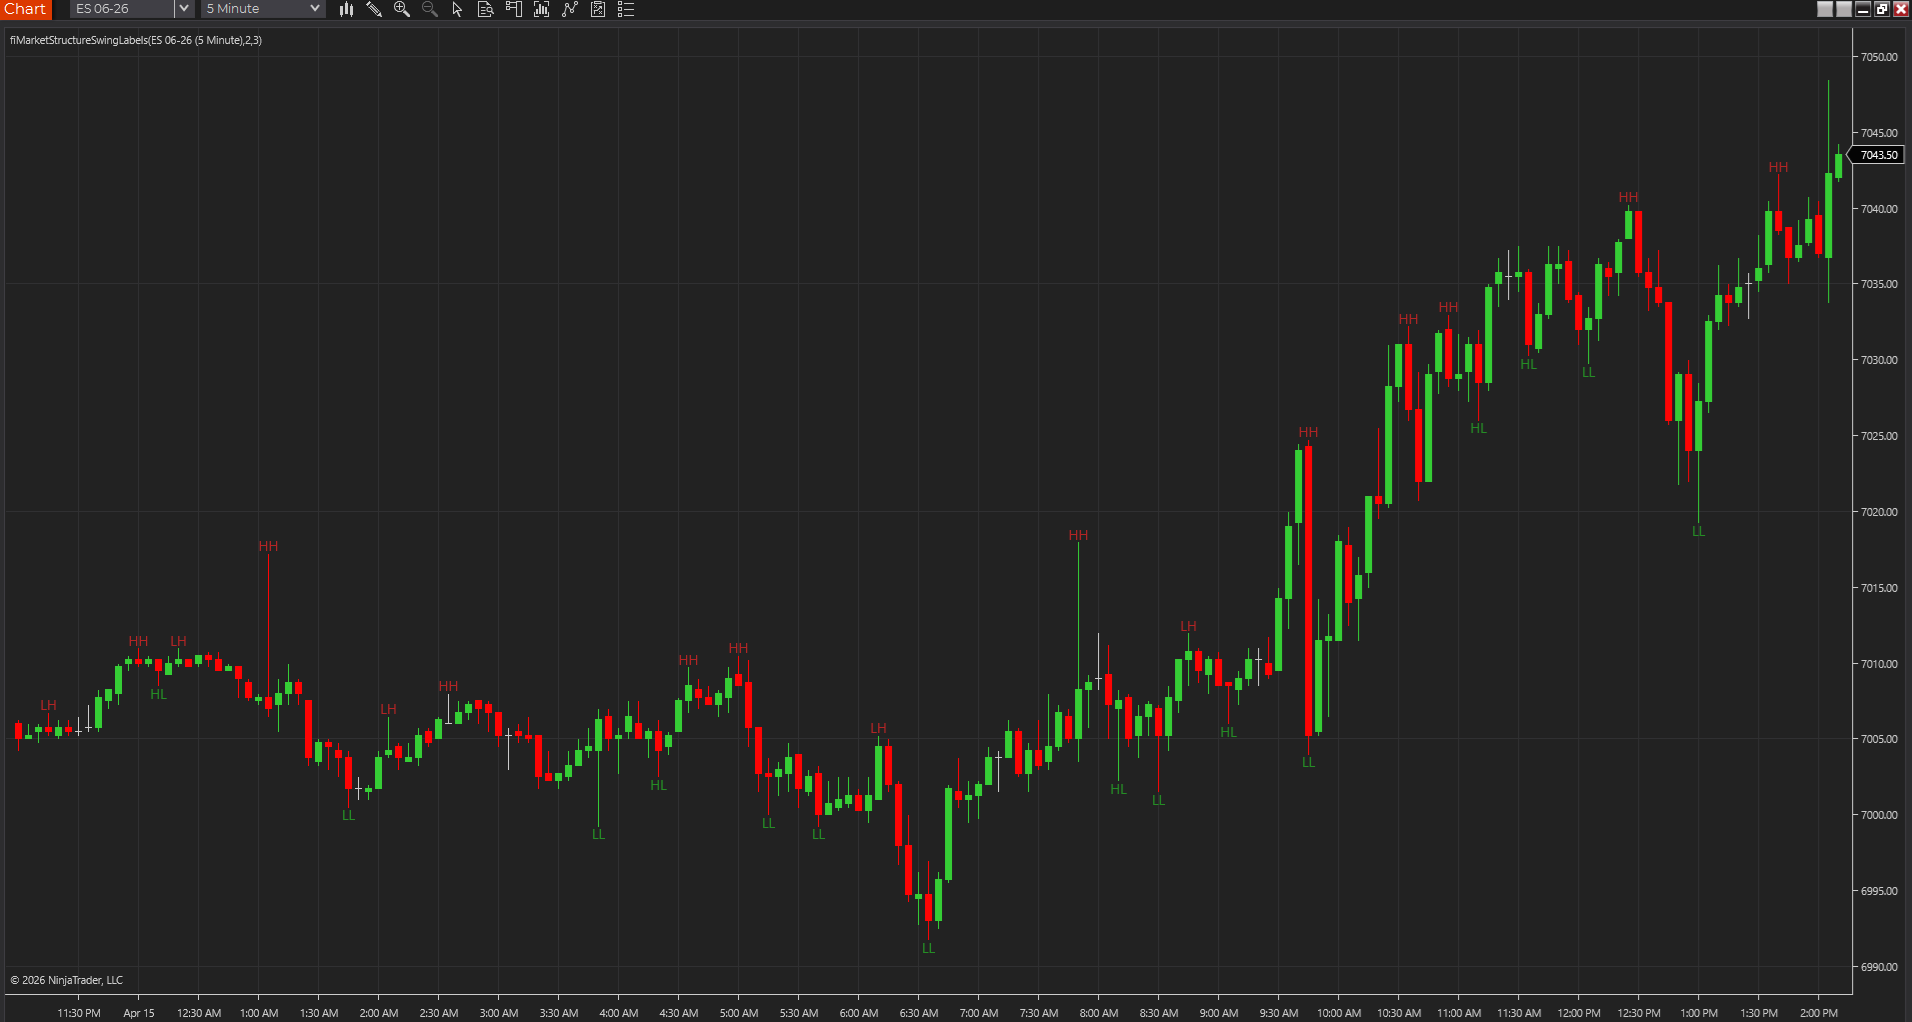
Swing sequence labeled on chartA chart capture showing swing labels directly on price to make the current structure sequence easier to read.
A practical comparison of TradingView Pine Script and NinjaScript for traders trying to decide when a browser-based workflow is enough and when a desktop platform is the better fit.
12 min readFeatured guide4 related tools4 chart screenshots
Read guide
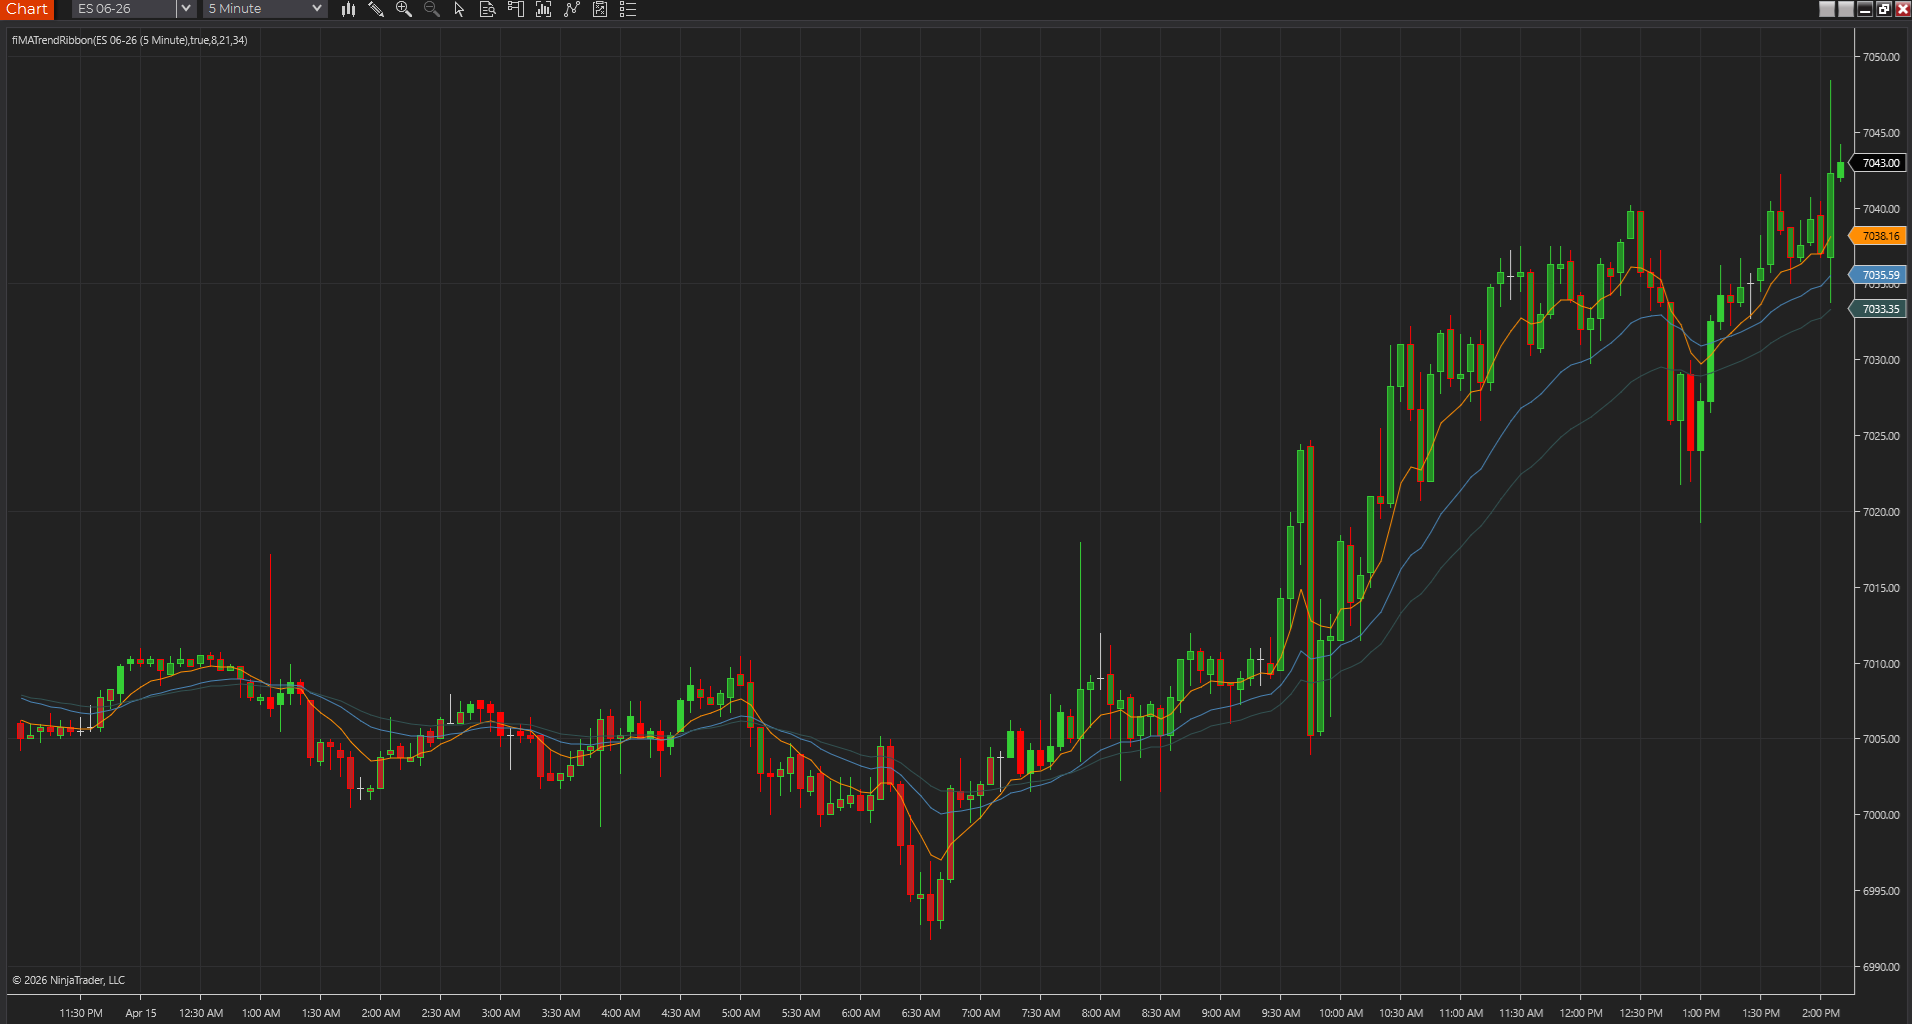
EMA ribbon alignment on chartA chart capture showing the Moving Average Trend Ribbon keeping short-term alignment and compression visible.
A beginner-friendly guide to choosing TradingView indicators without overloading the chart, with a focus on readable Pine Script tools and practical first workflows.
Beginner guideSupporting guide3 related tools3 chart screenshots
Read guide
Opening range mapped on chartA chart showing the opening range high, low, and midpoint held on screen for early-session context.
A practical guide to the best MultiCharts indicators for traders who want clearer PowerLanguage workflows, cleaner level mapping, and chart context they can actually trust.
Platform guideSupporting guide3 related tools3 chart screenshots
Read guide
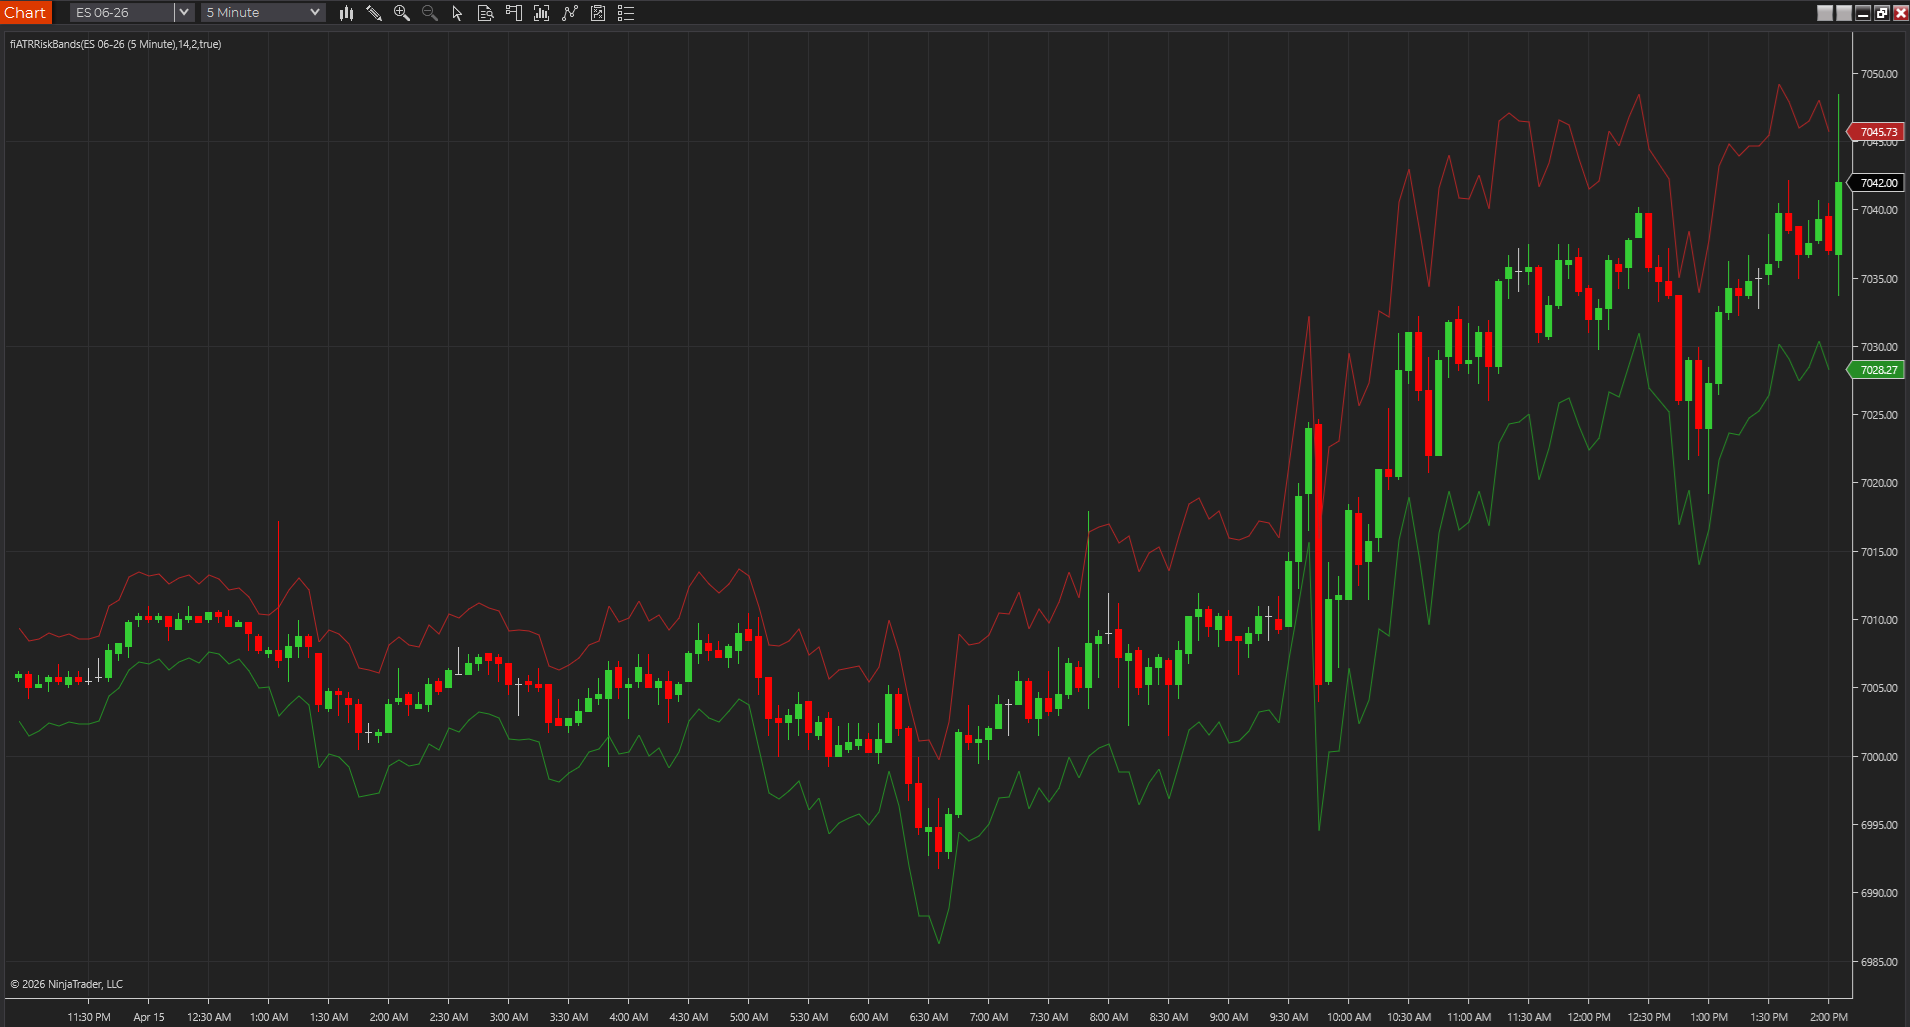
ATR bands around a directional moveA 5-minute futures chart with ATR Risk Bands framing the move using upper and lower volatility context.
A practical guide to the best MT5 indicators for traders who want cleaner MetaTrader 5 workflows, stronger chart context, and better long-term flexibility.
Platform guideSupporting guide3 related tools3 chart screenshots
Read guide
Clean chart structure at a glanceA broader chart image for guides about chart reading, platform workflow, and price-action context.
A practical guide to the best futures platforms for indicator users, comparing charting depth, scripting workflows, and how naturally each platform fits active futures trading.
Decision guideSupporting guideWorkflow articleExplainer format
Read guide
Opening range mapped on chartA chart showing the opening range high, low, and midpoint held on screen for early-session context.
A beginner-friendly comparison of TradingView and MetaTrader, with a little more honesty about where each one feels smooth and where it starts to feel heavy.
ComparisonSupporting guideWorkflow articleExplainer format
Read guide
ATR bands around a directional moveA 5-minute futures chart with ATR Risk Bands framing the move using upper and lower volatility context.
A practical comparison of NinjaTrader and TradeStation for indicator users deciding between an NT8 futures workflow and a more established EasyLanguage environment.
ComparisonSupporting guideWorkflow articleExplainer format
Read guide
ATR bands around a directional moveA 5-minute futures chart with ATR Risk Bands framing the move using upper and lower volatility context.
A practical guide to custom NinjaTrader indicator development, including what to bring to the request, what usually keeps the quote sane, and which changes tend to help most in the real world.
Service guideSupporting guideWorkflow articleExplainer format
Read guide
ATR bands around a directional moveA 5-minute futures chart with ATR Risk Bands framing the move using upper and lower volatility context.
A practical guide to moving TradingView ideas into NinjaTrader, including what usually carries over, what tends to break, and when a clean rewrite is the honest answer.
Service guideSupporting guideWorkflow articleExplainer format
Read guide
Clean chart structure at a glanceA broader chart image for guides about chart reading, platform workflow, and price-action context.
A practical guide to converting indicators between platforms without pretending the move is automatic, including what usually survives, what needs rewriting, and how to frame a realistic request.
Service guideSupporting guideWorkflow articleExplainer format
Read guide
Clean chart structure at a glanceA broader chart image for guides about chart reading, platform workflow, and price-action context.
A practical guide to custom TradeStation indicator development for traders using EasyLanguage workflows who need cleaner alerts, adapted logic, or builds that actually fit the way they already work.
Service guideSupporting guideWorkflow articleExplainer format
Read guide
Clean chart structure at a glanceA broader chart image for guides about chart reading, platform workflow, and price-action context.
A practical guide to custom MT4 and MT5 indicator development, including when to modify an existing MQL indicator, when to rebuild it, and how to prepare a request that leads to a usable tool instead of a vague coding ticket.
Service guideSupporting guideWorkflow articleExplainer format
Read guide
Clean chart structure at a glanceA broader chart image for guides about chart reading, platform workflow, and price-action context.
A practical guide for traders dealing with indicators that fail to compile, stop plotting correctly, or start acting weird after a platform change, import issue, or code edit.
Service guideSupporting guideWorkflow articleExplainer format
Read guide
Clean chart structure at a glanceA broader chart image for guides about chart reading, platform workflow, and price-action context.
A practical guide to converting a TradingView script into MT4 or MT5 without pretending Pine Script moves over automatically, including what to prepare and what usually changes during the port.
Service guideSupporting guideWorkflow articleExplainer format
Read guide
Clean chart structure at a glanceA broader chart image for guides about chart reading, platform workflow, and price-action context.
A practical guide to choosing the best platform for futures day traders, with a focus on chart workflow, indicator fit, customization depth, and how the choice affects the daily routine.
Decision guideSupporting guideWorkflow articleExplainer format
Read guide
Clean chart structure at a glanceA broader chart image for guides about chart reading, platform workflow, and price-action context.
A practical comparison of prop-firm and personal-account workflows for indicator traders, with attention to drawdown pressure, rule constraints, and how those differences change what a useful setup looks like.
Decision guideSupporting guideWorkflow articleExplainer format
Read guide
ATR bands around a directional moveA 5-minute futures chart with ATR Risk Bands framing the move using upper and lower volatility context.
A practical futures-focused comparison of NinjaTrader and TradingView for traders deciding between a deeper desktop workflow and a faster chart-first environment.
ComparisonSupporting guideWorkflow articleExplainer format
Read guide
ATR bands around a directional moveA 5-minute futures chart with ATR Risk Bands framing the move using upper and lower volatility context.
A practical guide to whether a Pine Script can be converted to NinjaScript, what usually carries over well, and where traders should expect differences instead of exact one-to-one behavior.
Conversion guideSupporting guideWorkflow articleExplainer format
Read guide
Clean chart structure at a glanceA broader chart image for guides about chart reading, platform workflow, and price-action context.
A practical guide to converting EasyLanguage to PowerLanguage, including when the move is straightforward, where hidden differences still matter, and how to scope the work honestly.
Conversion guideSupporting guideWorkflow articleExplainer format
Read guide
Session VWAP on a live chartA chart capture showing Session VWAP anchored to the trading day for intraday fair-value context.
A featured guide to choosing trading indicators by workflow, market, and decision-making job instead of just following whatever sounds popular.
11 min readFeatured guide4 related tools4 chart screenshots
Read guide
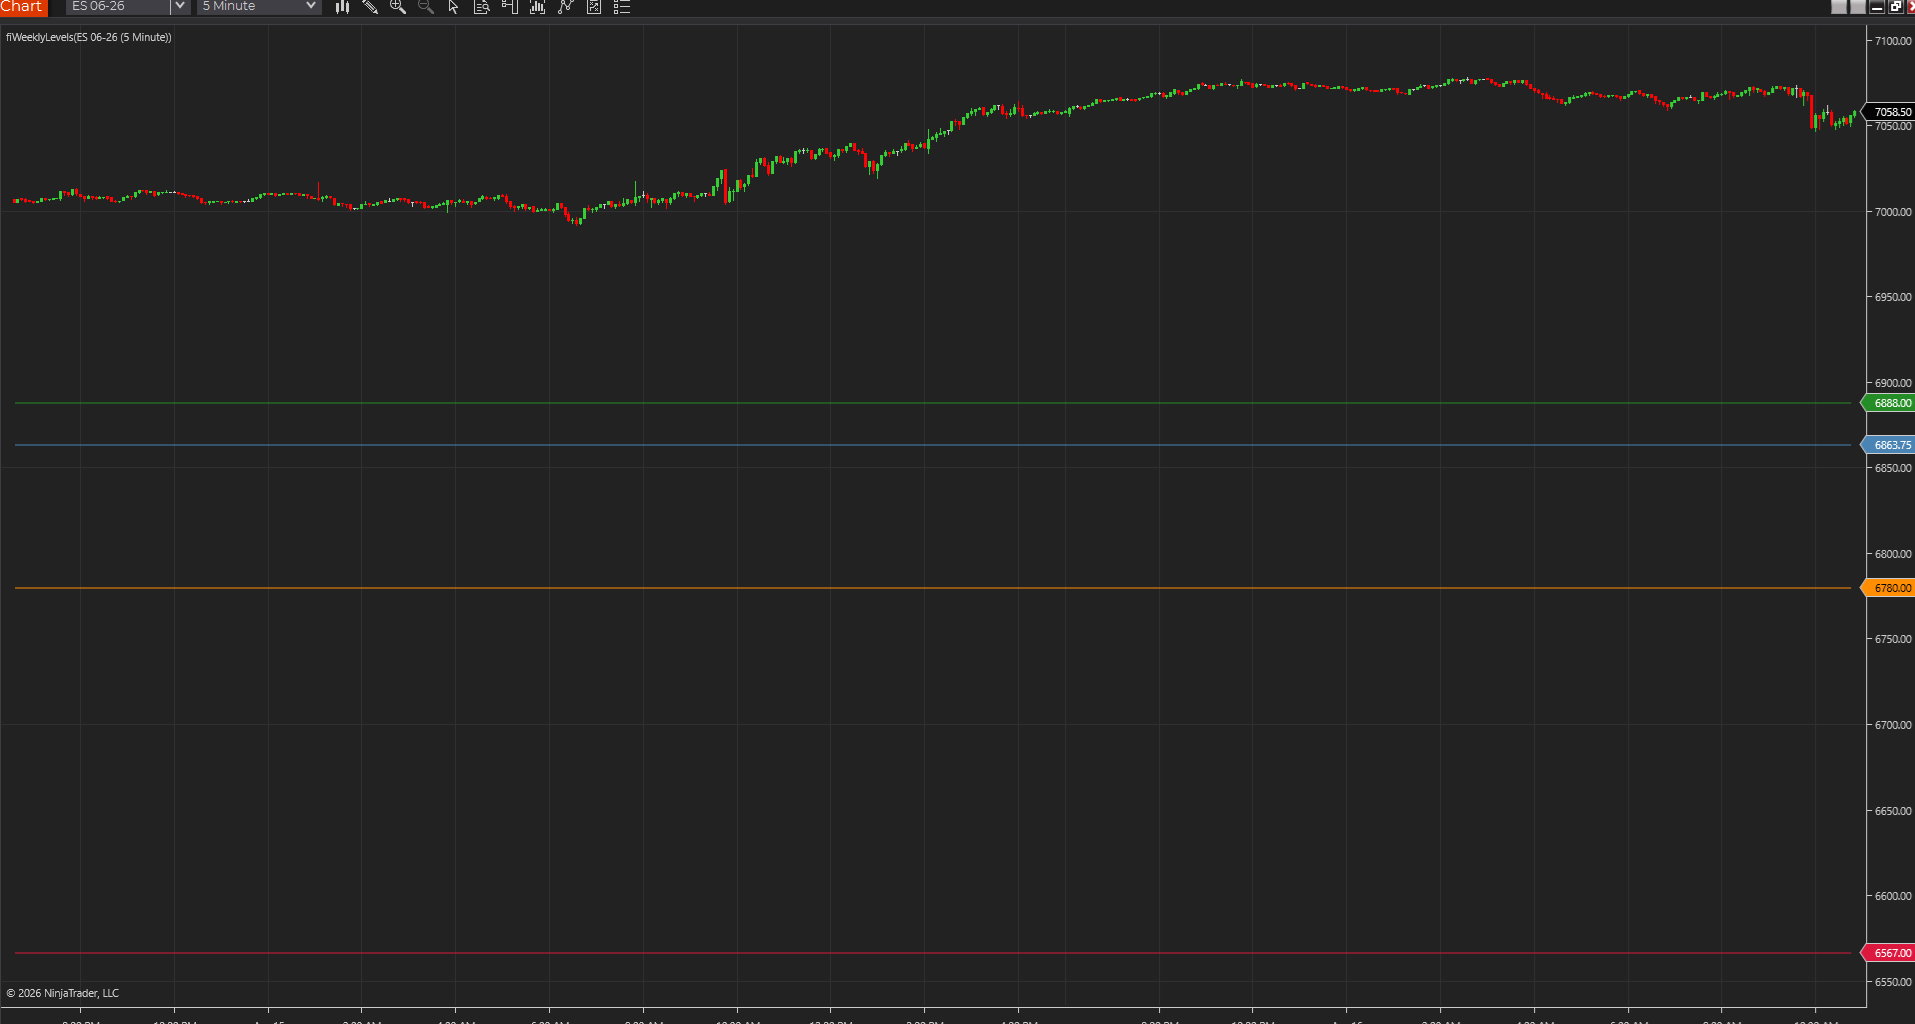
Prior-session references on chartA chart showing session reference lines such as prior levels and the session open held in view during live trade.
A featured guide to support and resistance indicators that help traders map literal session levels, derived ladders, retracements, and psychological price zones.
10 min readFeatured guide4 related tools4 chart screenshots
Read guide
Prior-session references on chartA chart showing session reference lines such as prior levels and the session open held in view during live trade.
A practical guide to breakout indicators for traders who want a cleaner read on opening drive levels, rolling range edges, and participation behind expansion.
BreakoutsSupporting guide4 related tools4 chart screenshots
Read guide
Session VWAP on a live chartA chart capture showing Session VWAP anchored to the trading day for intraday fair-value context.
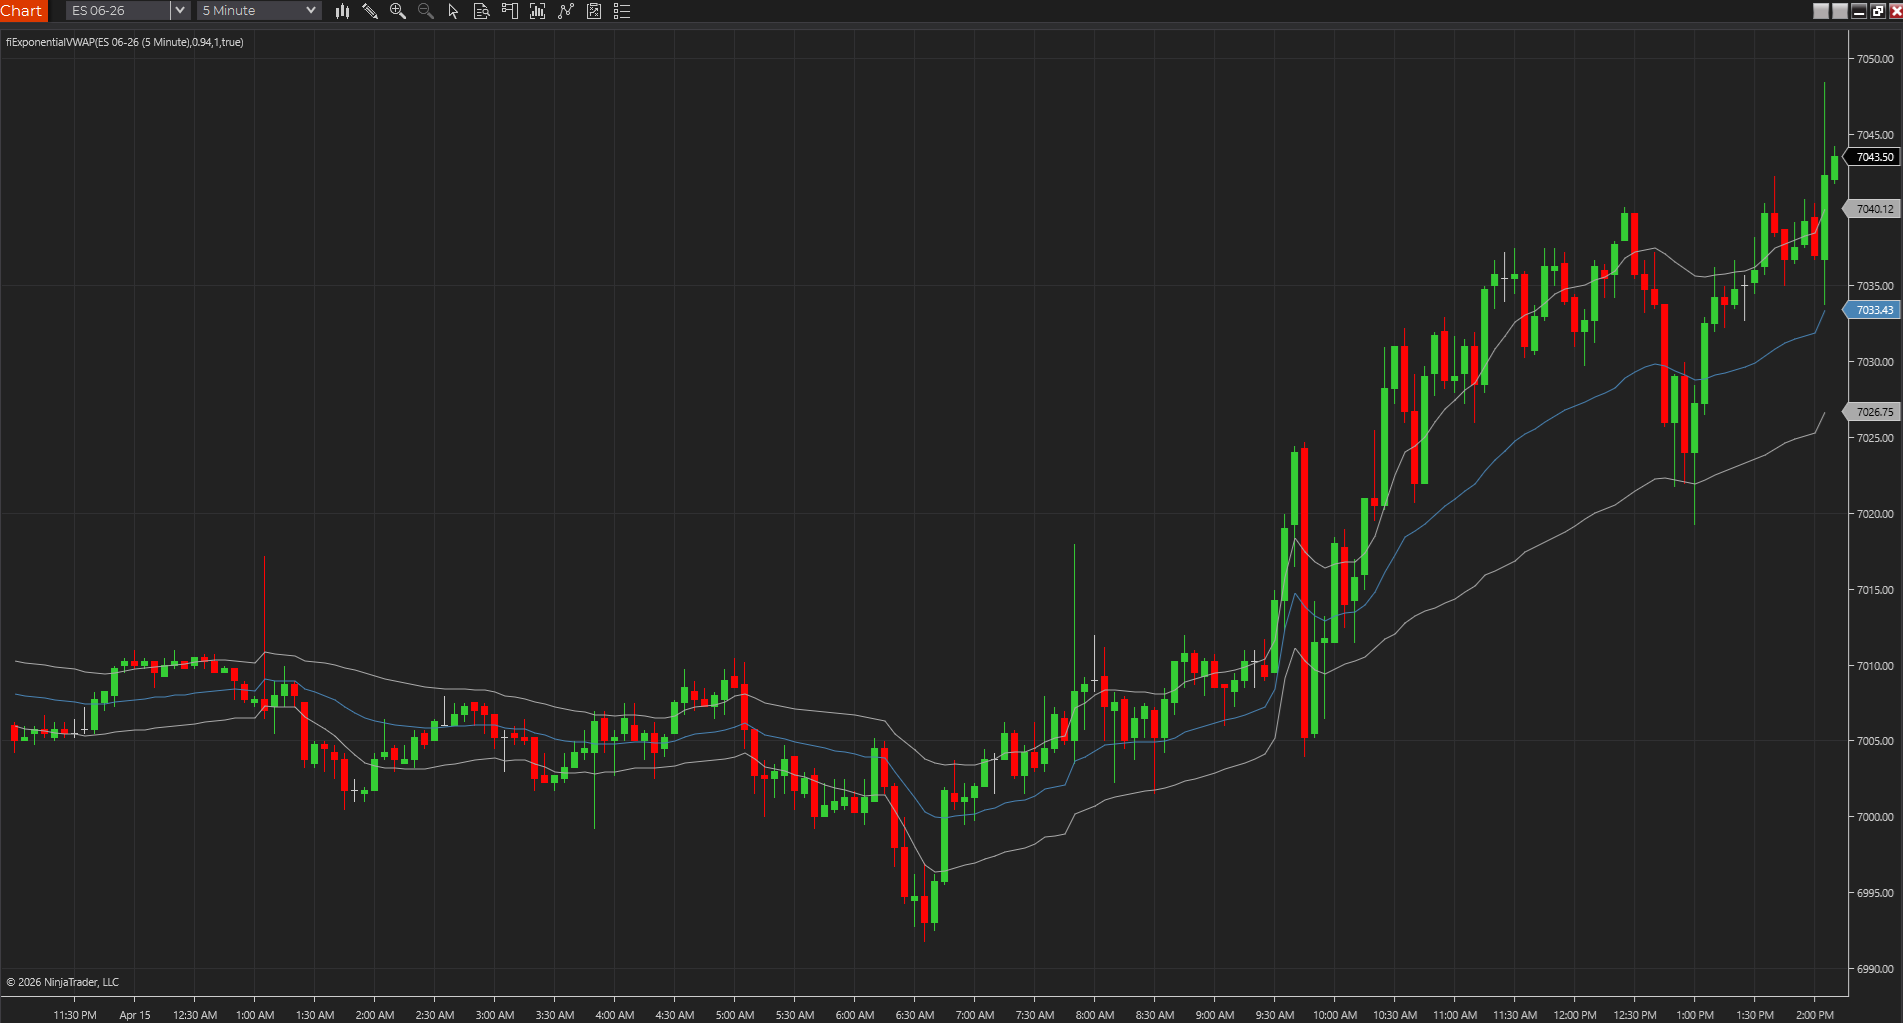
A direct comparison between a steady session-reset VWAP and a faster exponential VWAP for traders deciding how quickly their fair-value reference should respond.
ComparisonSupporting guide2 related tools2 chart screenshots
Read guide
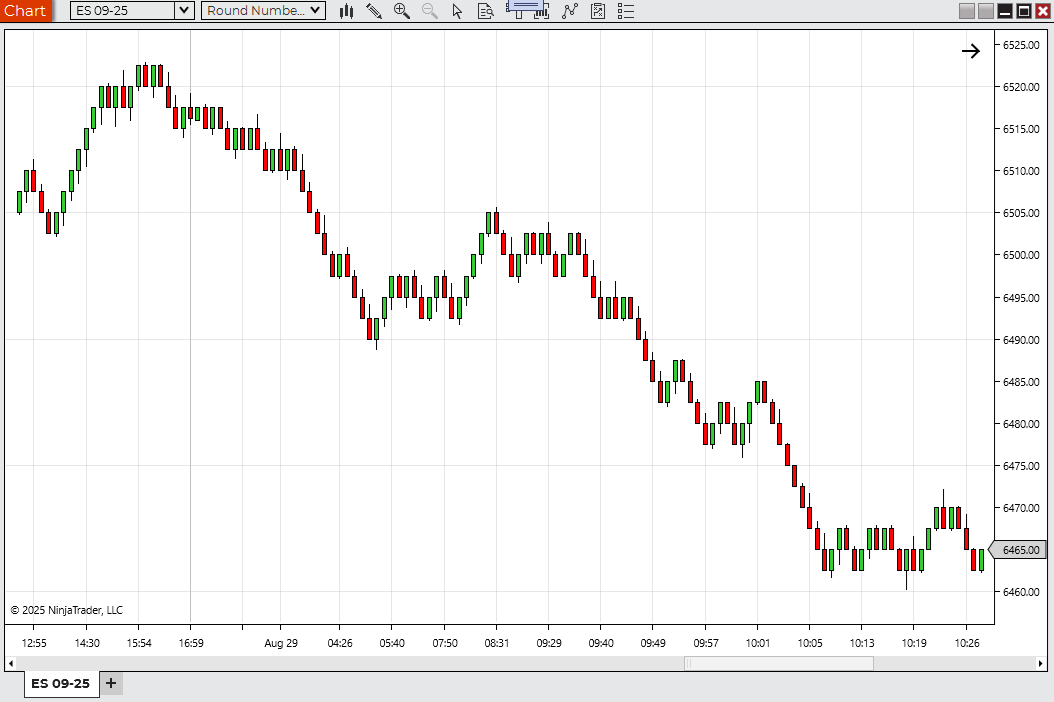
Psychological levels on chartA chart showing Round Number Levels marking clean psychological price intervals.
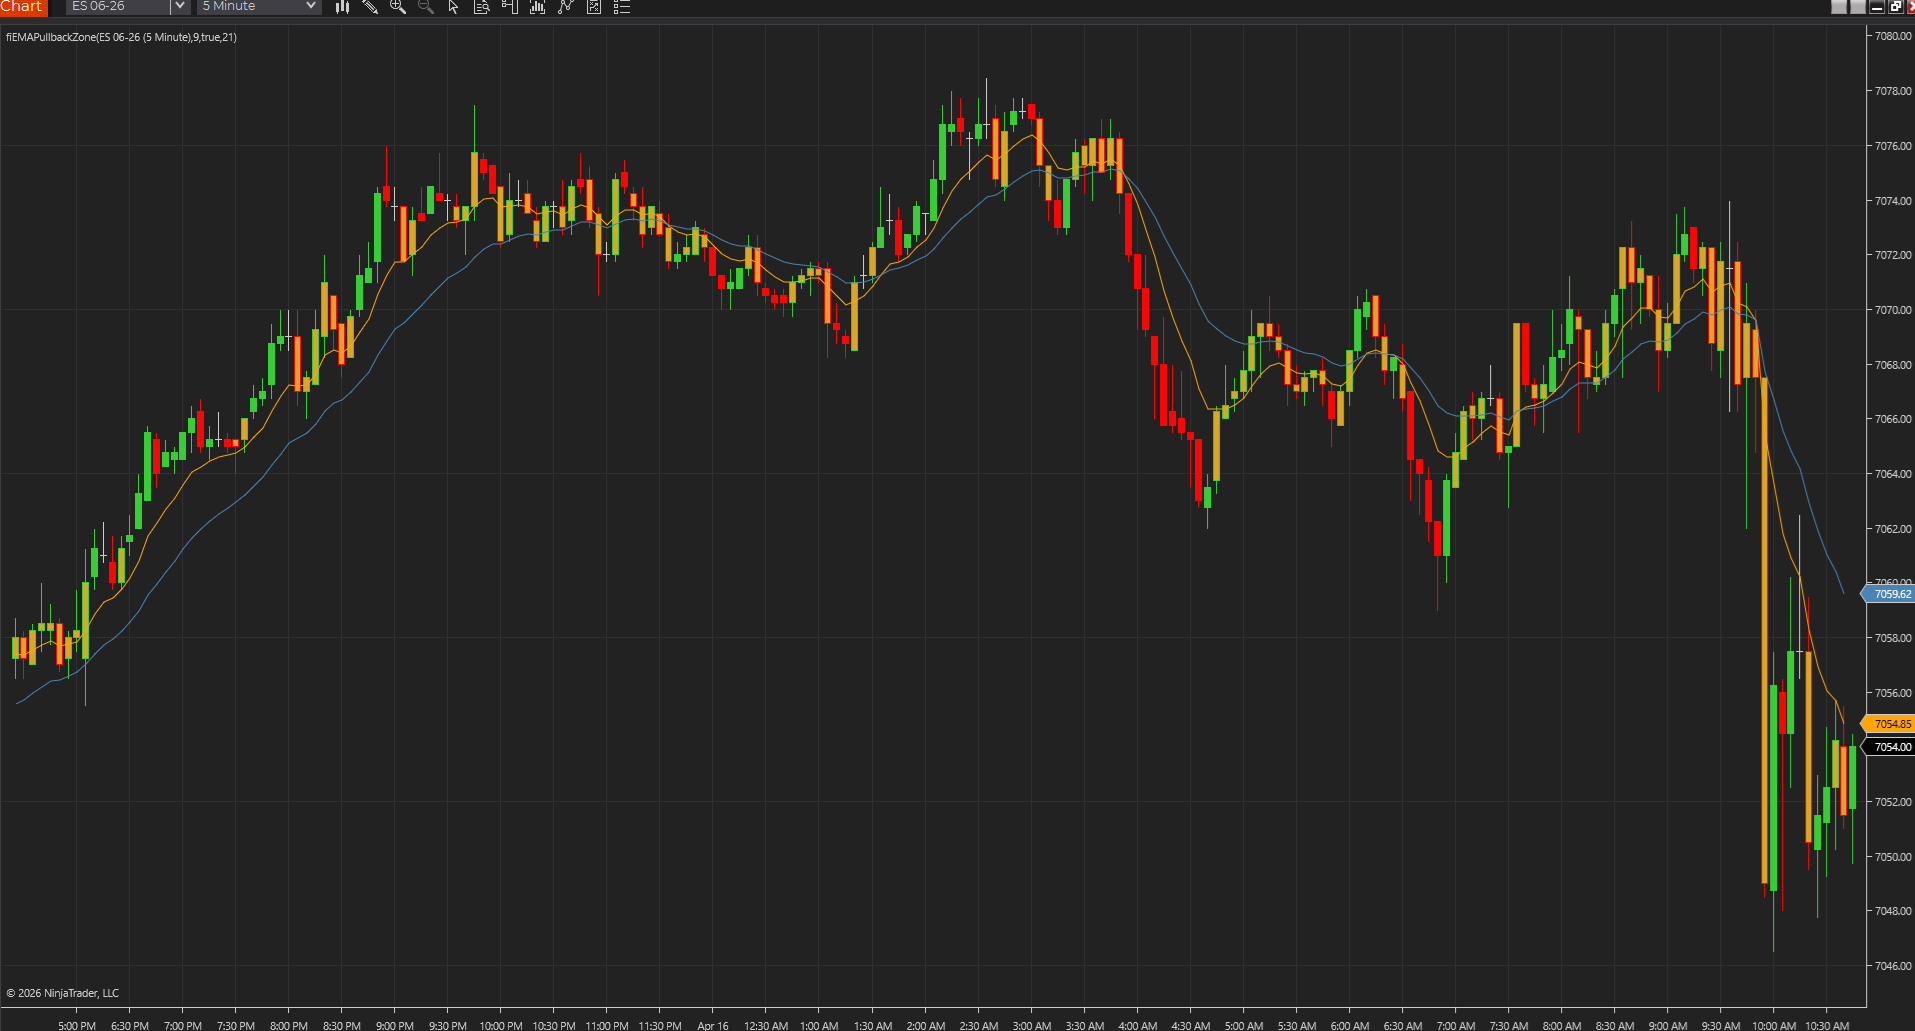
A practical guide to trend-following indicators for traders who want cleaner pullback context, trend-state confirmation, and more disciplined chart structure.
TrendSupporting guide4 related tools4 chart screenshots
Read guide
Prior-session references on chartA chart showing session reference lines such as prior levels and the session open held in view during live trade.
A guide to support and resistance indicators for active intraday traders who want cleaner session references, psychological levels, and practical chart maps.
LevelsSupporting guide4 related tools4 chart screenshots
Read guide
Session VWAP on a live chartA chart capture showing Session VWAP anchored to the trading day for intraday fair-value context.
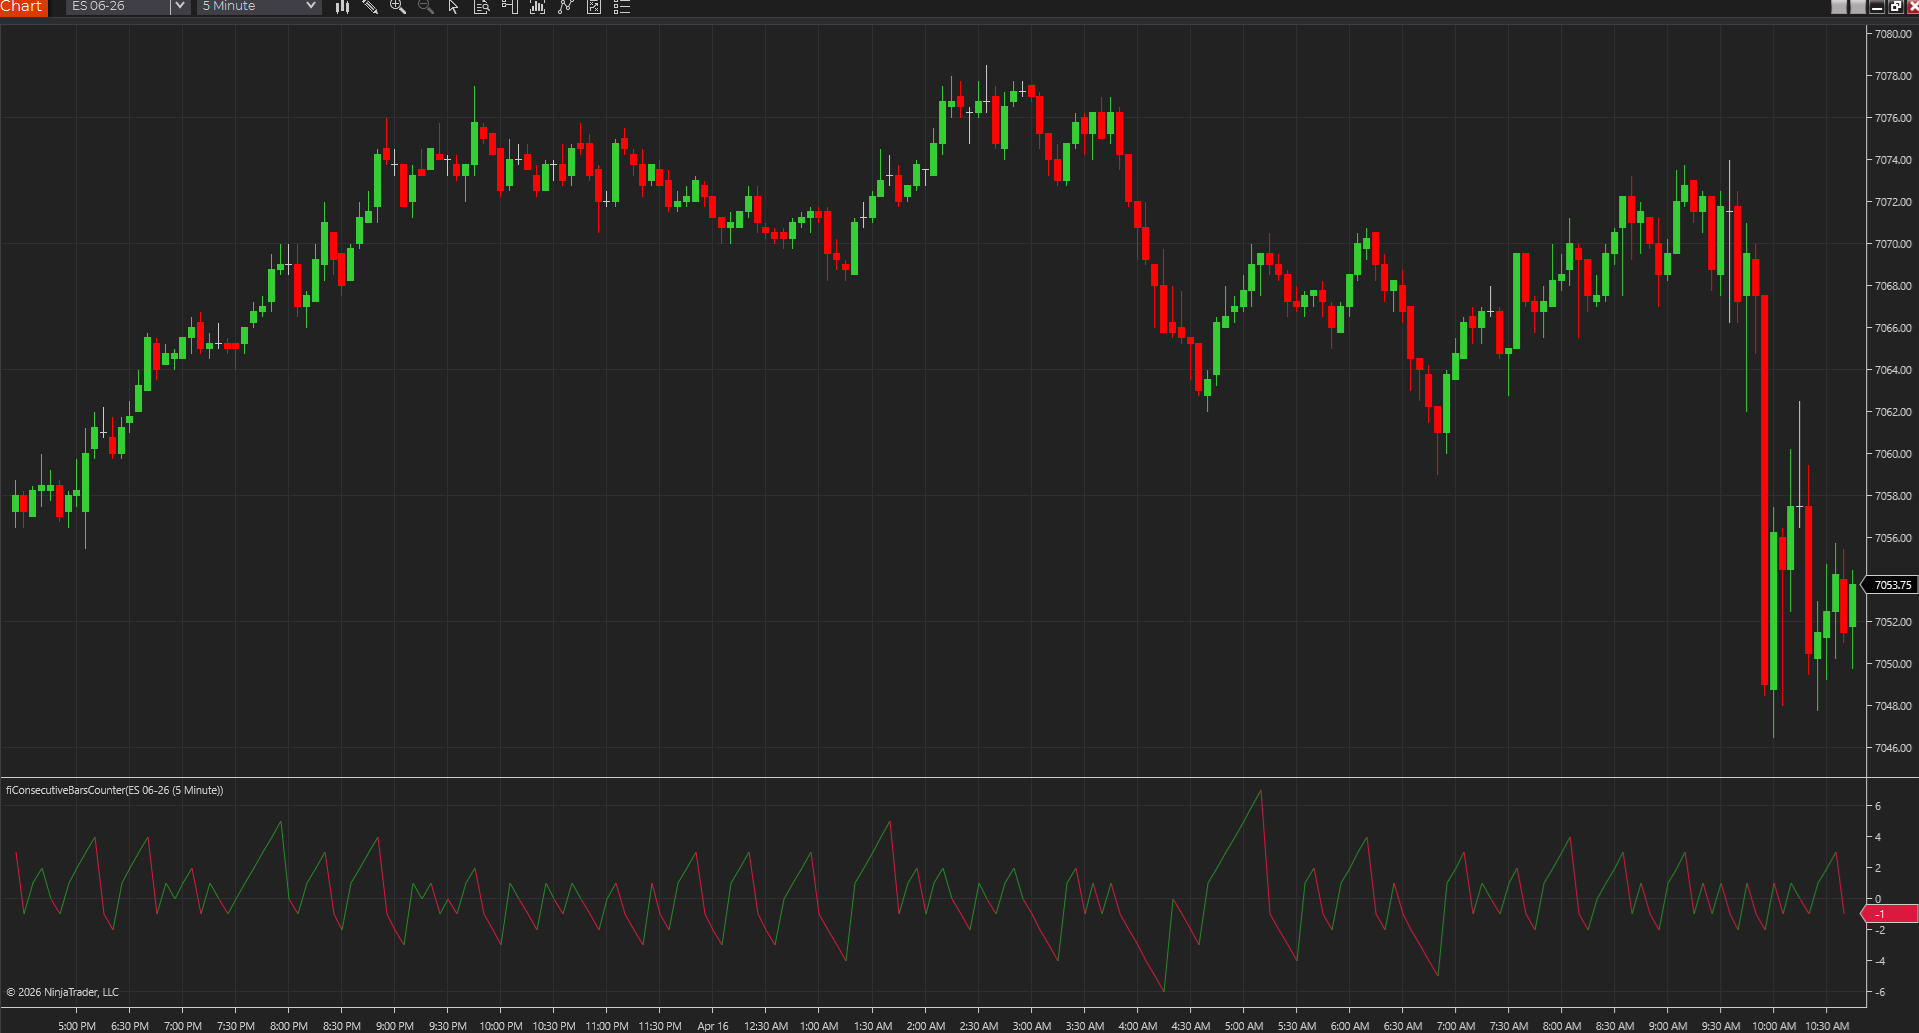
A practical guide to using consecutive bars counts for exhaustion, continuation, and cleaner short-term price-action reads.
Price actionSupporting guide3 related tools3 chart screenshots
Read guide
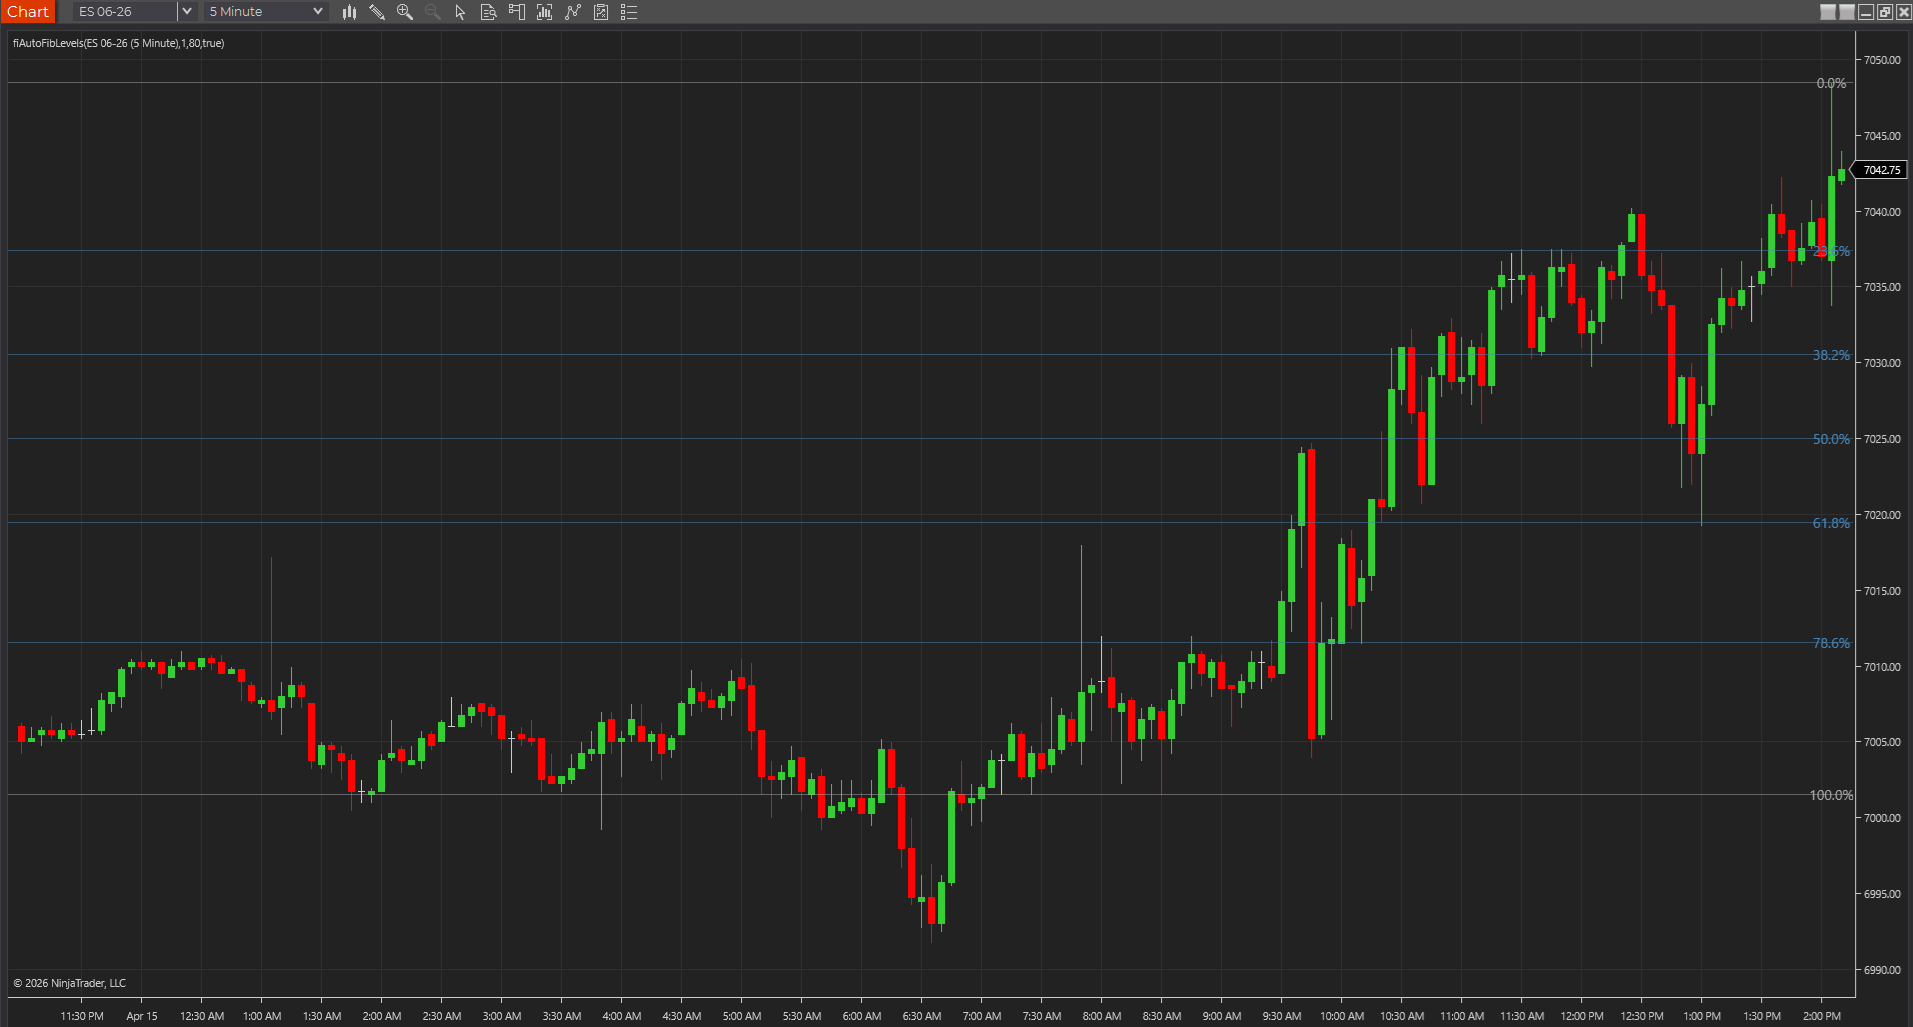
Retracement levels on a live chartA chart showing the recent swing range with automatic Fibonacci retracement levels held on screen for pullback reference.
A real-world guide to the free NinjaTrader indicators most worth your screen space, with a simple way to choose tools for structure, levels, participation, volatility, and intraday decisions.
12 min readFeatured guide4 related tools4 chart screenshots
Read guide
Faster VWAP context on chartA chart capture showing Exponential VWAP as a faster fair-value reference during intraday movement.
A direct comparison for traders deciding whether they need fair-value context, derived ladder levels, or raw prior-session references.
ComparisonSupporting guide3 related tools3 chart screenshots
Read guide
Swing sequence labeled on chartA chart capture showing swing labels directly on price to make the current structure sequence easier to read.
A featured guide to price action indicators that help organize compression, breakouts, levels, and structure without pretending to replace judgment.
11 min readFeatured guide4 related tools4 chart screenshots
Read guide
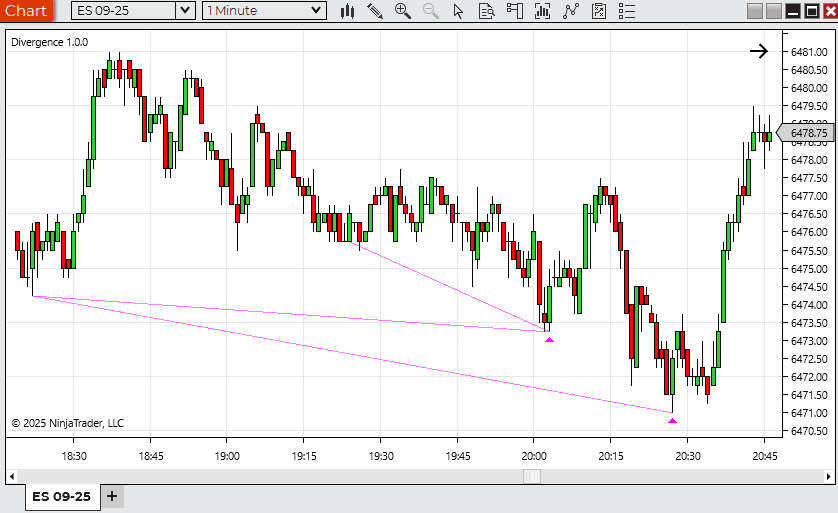
Structure and divergence contextA broader chart image used where guide or category pages need a stronger visual anchor around structure, reversal, or pattern reading.
When a faster exponential VWAP-style line is more useful than a standard session VWAP, and when the extra responsiveness becomes noise.
ComparisonSupporting guide2 related tools2 chart screenshots
Read guide
Prior-session references on chartA chart showing session reference lines such as prior levels and the session open held in view during live trade.
A practical look at when an ATR-based stop overlay is more useful than a moving-average trend ribbon, and when traders benefit from both.
ComparisonSupporting guide2 related tools2 chart screenshots
Read guide
Swing sequence labeled on chartA chart capture showing swing labels directly on price to make the current structure sequence easier to read.
How swing-label tools differ from simple bar-pattern markers, and why they help with different parts of a price-action workflow.
ComparisonSupporting guide2 related tools2 chart screenshots
Read guide
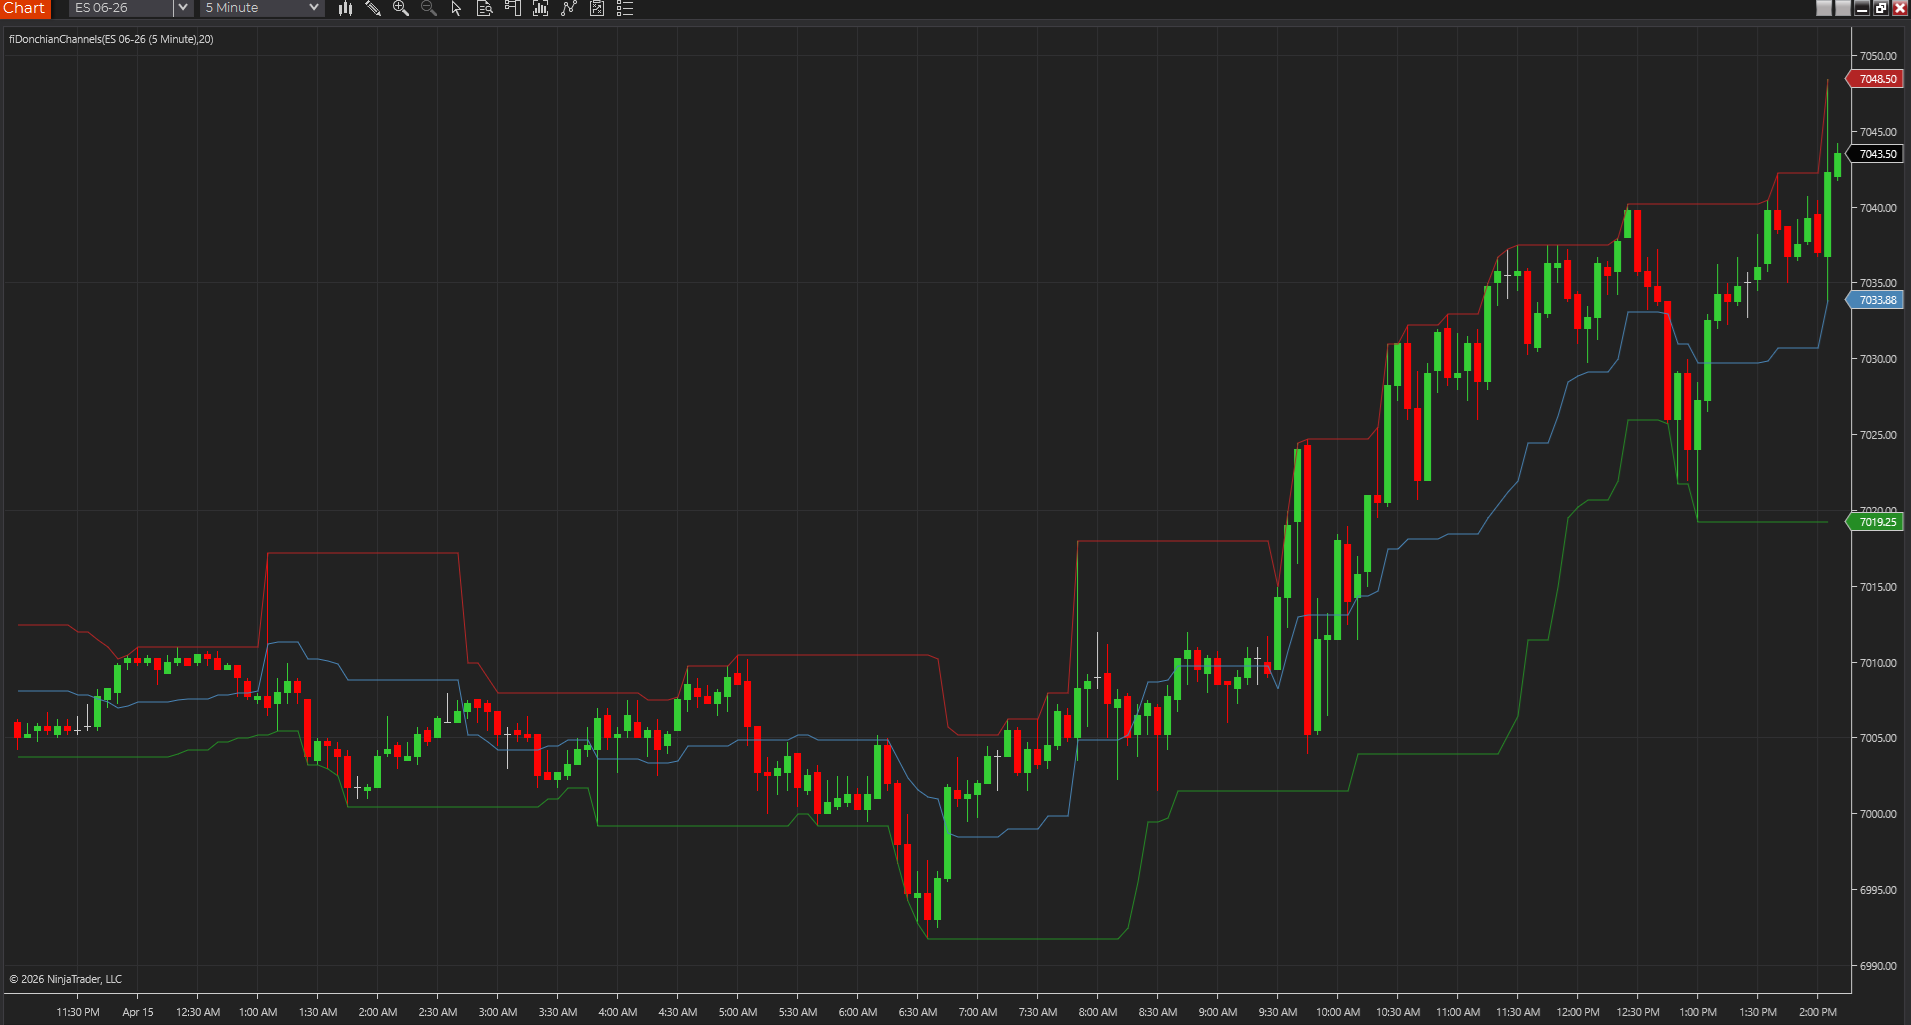
Recent range boundaries on chartA chart showing Donchian Channels defining the current breakout and pullback envelope from the recent lookback range.
A trader-friendly guide to free VWAP indicators, including session VWAP, anchored VWAP, deviation bands, and faster variants that behave differently when the day speeds up.
10 min readFeatured guide4 related tools4 chart screenshots
Read guide
Opening range mapped on chartA chart showing the opening range high, low, and midpoint held on screen for early-session context.
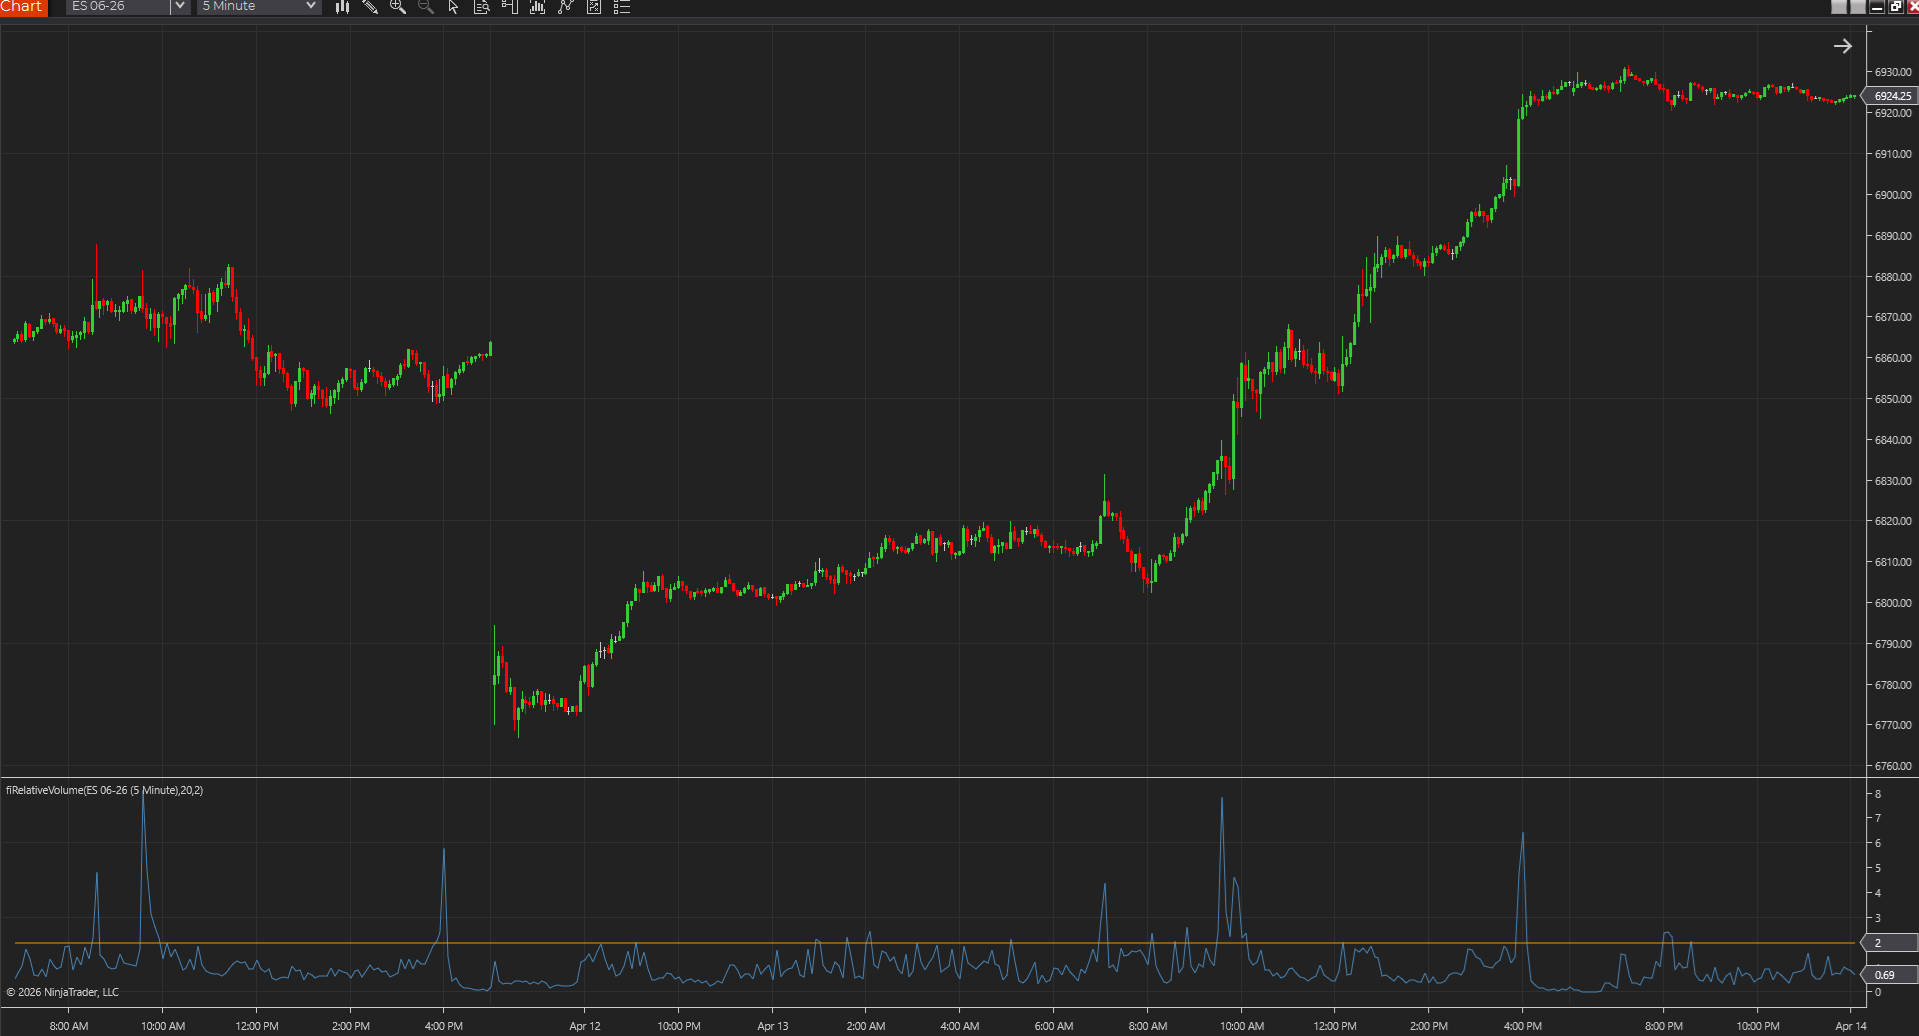
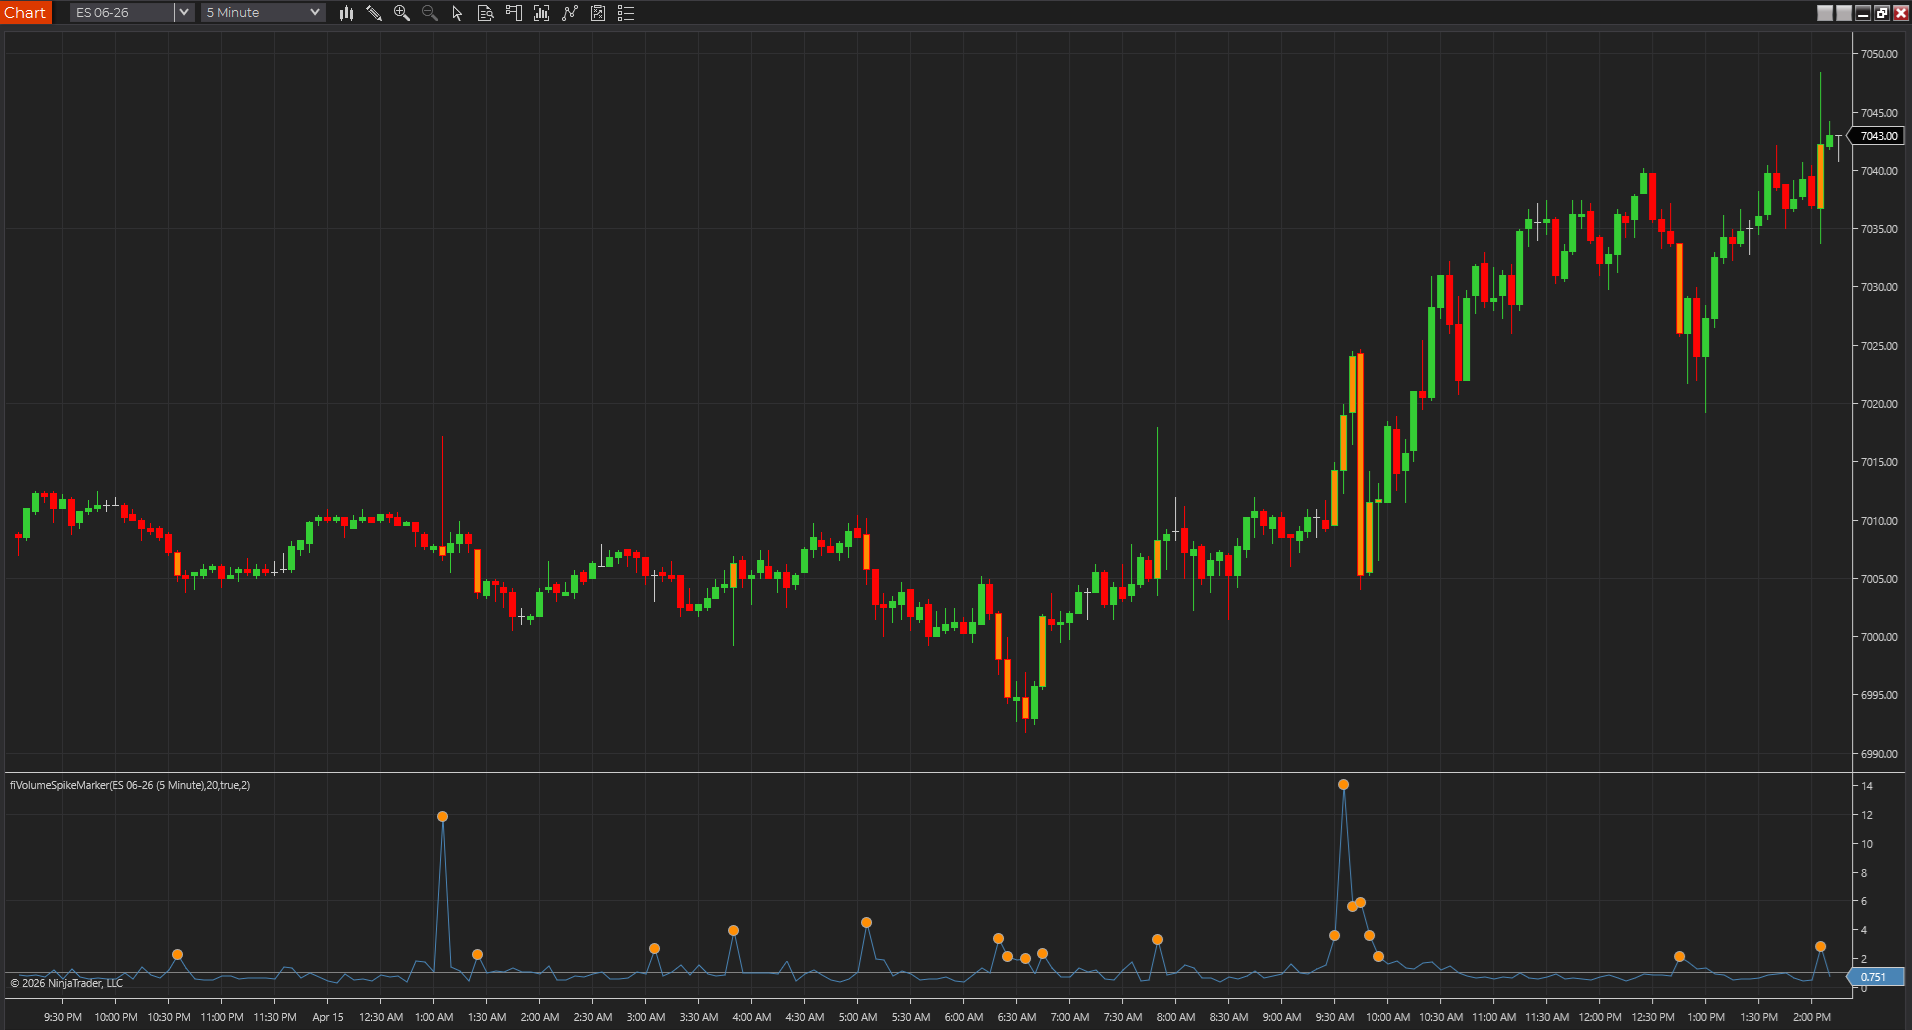
How to think about a NinjaTrader volume spike indicator, including threshold tuning, feed differences, and when a spike is actually worth caring about.
Volume spikeSupporting guide2 related tools2 chart screenshots
Read guide
Opening range mapped on chartA chart showing the opening range high, low, and midpoint held on screen for early-session context.
A direct answer for traders trying to import NinjaTrader 8 indicator ZIP files without wrecking an existing workspace.
Install guideSupporting guide2 related tools2 chart screenshots
Read guide
Prior-session references on chartA chart showing session reference lines such as prior levels and the session open held in view during live trade.
A clean checklist for importing, testing, and troubleshooting NinjaTrader indicator packages.
GuideSupporting guideWorkflow articleExplainer format
Read guide
Pivot map on a live sessionA chart showing the classic pivot framework with session-derived support and resistance levels already on screen.
A plain-English answer for traders wondering whether older NinjaTrader indicators will actually run on newer installs.
GuideSupporting guideWorkflow articleExplainer format
Read guide
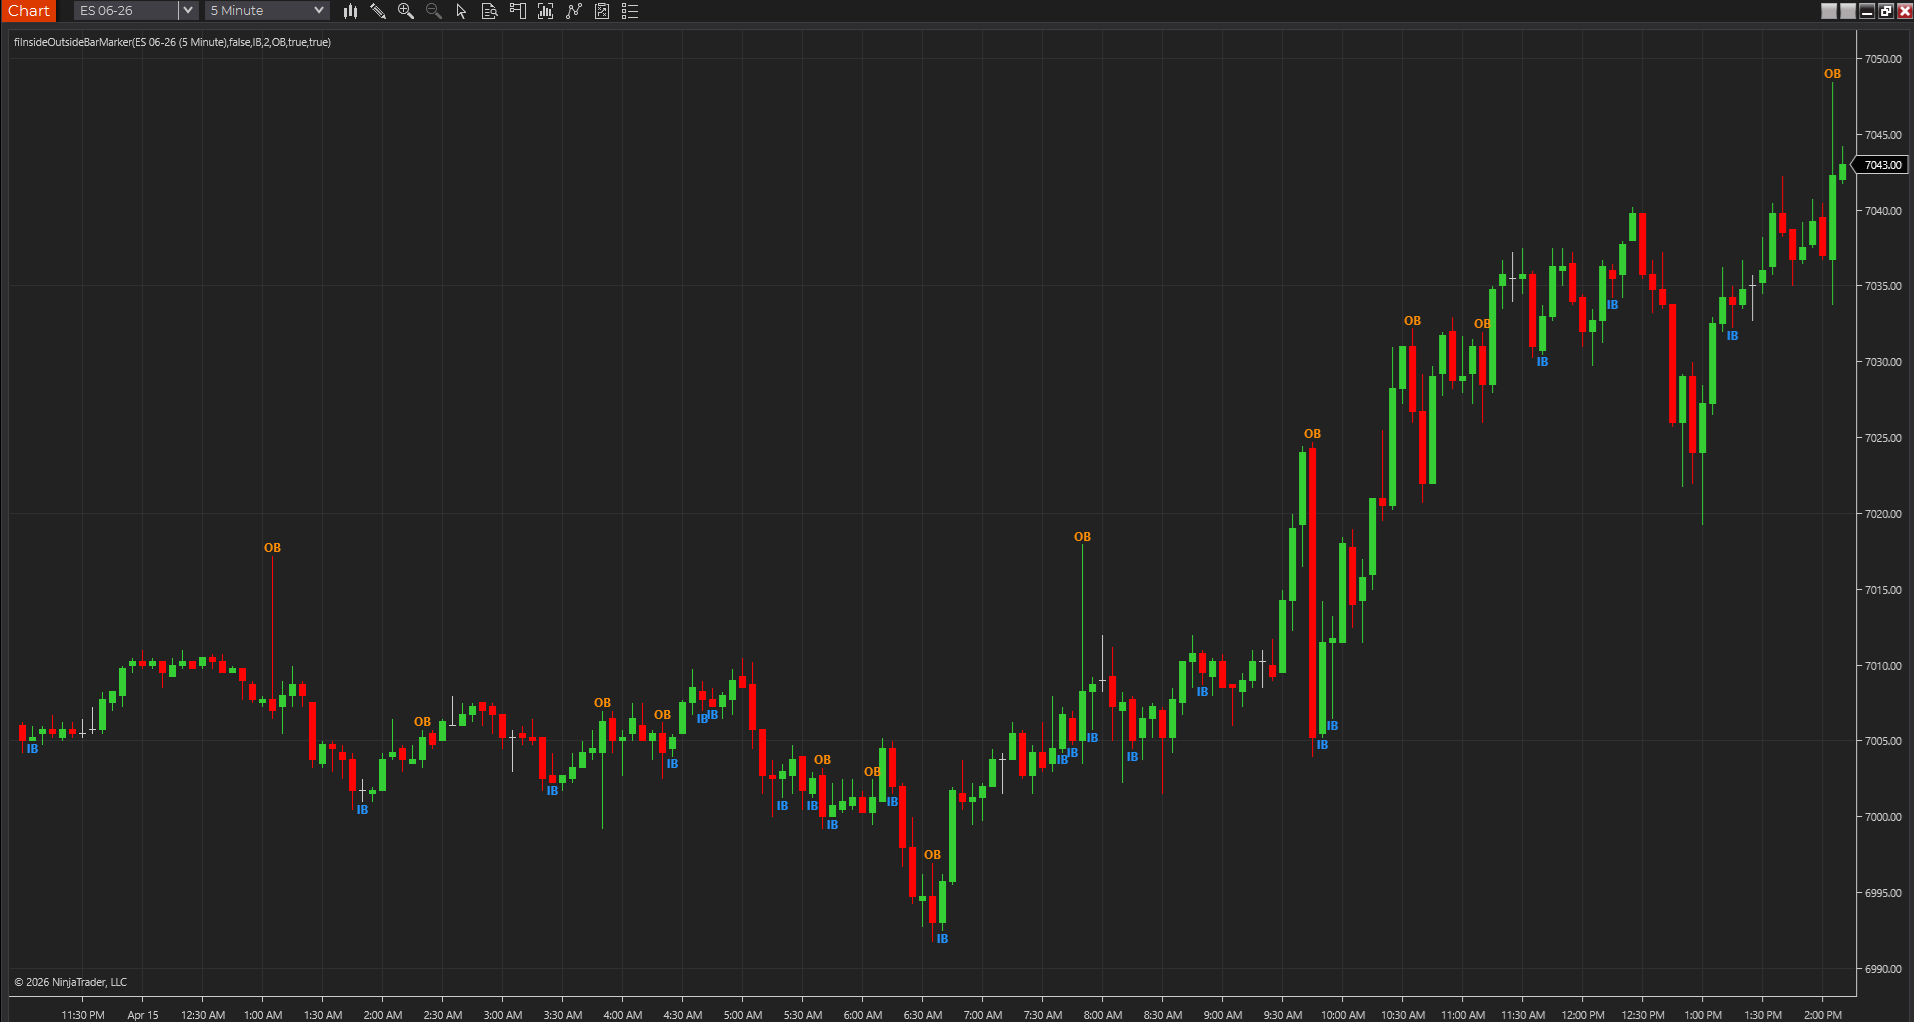
Inside and outside bars marked liveA chart showing the Inside/Outside Bar Marker calling out compression and expansion bars directly on price.
A practical comparison of TradingView Pine Script and NinjaScript for traders trying to decide when a browser-based workflow is enough and when a desktop platform is the better fit.
12 min read4 related tools4 chart screenshots
Read guide
Session VWAP on a live chartA chart capture showing Session VWAP anchored to the trading day for intraday fair-value context.
A featured guide to choosing trading indicators by workflow, market, and decision-making job instead of just following whatever sounds popular.
11 min read4 related tools4 chart screenshots
Read guide
Prior-session references on chartA chart showing session reference lines such as prior levels and the session open held in view during live trade.
A featured guide to support and resistance indicators that help traders map literal session levels, derived ladders, retracements, and psychological price zones.
10 min read4 related tools4 chart screenshots
Read guide
Opening range mapped on chartA chart showing the opening range high, low, and midpoint held on screen for early-session context.
A real-world guide to the free NinjaTrader indicators most worth your screen space, with a simple way to choose tools for structure, levels, participation, volatility, and intraday decisions.
12 min read4 related tools4 chart screenshots
Read guide
Opening range mapped on chartA chart showing the opening range high, low, and midpoint held on screen for early-session context.
A trader-friendly guide to free VWAP indicators, including session VWAP, anchored VWAP, deviation bands, and faster variants that behave differently when the day speeds up.
A practical shortlist of free trading indicators that already have real download files, chart screenshots, and usable page support instead of vague writeups with nowhere to click next.
Decision guide5 related tools5 chart screenshots
Read
Bar tempo on a live chartA chart capture showing how Bar Speed keeps changing participation tempo visible while price rotates and expands.
A practical guide to the indicator pages that already include source-backed logic or platform source pages, so traders can inspect, port, or adapt the tool instead of treating it like a black box.
Trust guide4 related tools4 chart screenshots
Read
Clean chart structure at a glanceA broader chart image for guides about chart reading, platform workflow, and price-action context.
A practical guide to the three main kinds of indicator pages traders run into, and why using the wrong expectation on the wrong page creates confusion fast.
Decision guideReference articleWorkflow article
Read
Opening range mapped on chartA chart showing the opening range high, low, and midpoint held on screen for early-session context.
A practical guide to building a simple futures-open chart with just enough structure, participation, and risk context to make fast decisions without turning the screen into indicator soup.
Workflow guide5 related tools5 chart screenshots
Read
Opening range mapped on chartA chart showing the opening range high, low, and midpoint held on screen for early-session context.
A practical guide to testing trading indicators in market replay without giving them perfect hindsight, false confidence, or credit for decisions they did not really help with.
Testing guide4 related tools4 chart screenshots
Read
Prior-session references on chartA chart showing session reference lines such as prior levels and the session open held in view during live trade.
A practical cleanup guide for traders whose futures charts have become so crowded with levels, signals, and overlays that the indicator stack is making decisions harder instead of easier.
Workflow guide4 related tools4 chart screenshots
Read
Session VWAP on a live chartA chart capture showing Session VWAP anchored to the trading day for intraday fair-value context.
A practical framework for traders who want a simple futures workflow that can survive the jump between NinjaTrader, TradingView, TradeStation, MetaTrader, or MultiCharts without losing its logic.
Workflow guide4 related tools4 chart screenshots
Read
Trend-day pressure meterA chart showing Trend Day Strength Meter scoring session-open extension and persistence in a lower panel.
A practical workflow guide for building a futures trend-day chart that stays focused on direction, pullback quality, and risk instead of piling on indicators that all say the same thing.
Workflow guide4 related tools4 chart screenshots
Read
Session VWAP on a live chartA chart capture showing Session VWAP anchored to the trading day for intraday fair-value context.
A practical guide to building a futures range-day chart that helps traders frame balance, failed breakouts, and location without mistaking every small move for the start of a trend.
Workflow guide4 related tools4 chart screenshots
Read
Opening range mapped on chartA chart showing the opening range high, low, and midpoint held on screen for early-session context.
A practical futures workflow guide for traders who care most about confirming whether a breakout has enough structure, participation, and follow-through to deserve attention.
Workflow guide4 related tools4 chart screenshots
Read
Prior-session references on chartA chart showing session reference lines such as prior levels and the session open held in view during live trade.
A futures-first shortlist of NinjaTrader indicators for traders who need cleaner session context, participation cues, structure, and risk framing instead of a crowded chart.
High-intent path4 related tools4 chart screenshots
Read
Opening range mapped on chartA chart showing the opening range high, low, and midpoint held on screen for early-session context.
A futures-focused comparison of session VWAP and anchored VWAP, including when each one gives the cleaner read on fair value, event-driven context, and session structure.
Comparison3 related tools3 chart screenshots
Read
Pivot map on a live sessionA chart showing the classic pivot framework with session-derived support and resistance levels already on screen.
A direct comparison of gap levels and prior-session levels for futures traders deciding whether the overnight separation or the prior auction map deserves more weight.
Comparison3 related tools3 chart screenshots
Read
Prior-session references on chartA chart showing session reference lines such as prior levels and the session open held in view during live trade.
A practical workflow for combining session levels, pivots, gaps, and a few higher-time-frame references without turning a futures chart into a maze of lines.
Workflow stack4 related tools4 chart screenshots
Read
Bar tempo on a live chartA chart capture showing how Bar Speed keeps changing participation tempo visible while price rotates and expands.
A practical guide to the best TradingView indicators for structure, trend, session context, and participation when you care more about usable Pine scripts than marketplace hype.
Platform guide4 related tools4 chart screenshots
Read
Swing sequence labeled on chartA chart capture showing swing labels directly on price to make the current structure sequence easier to read.
A beginner-friendly guide to choosing TradingView indicators without overloading the chart, with a focus on readable Pine Script tools and practical first workflows.
Beginner guide3 related tools3 chart screenshots
Read
Opening range mapped on chartA chart showing the opening range high, low, and midpoint held on screen for early-session context.
A practical guide to the best MultiCharts indicators for traders who want clearer PowerLanguage workflows, cleaner level mapping, and chart context they can actually trust.
Platform guide3 related tools3 chart screenshots
Read
ATR bands around a directional moveA 5-minute futures chart with ATR Risk Bands framing the move using upper and lower volatility context.
A practical guide to the best MT5 indicators for traders who want cleaner MetaTrader 5 workflows, stronger chart context, and better long-term flexibility.
Platform guide3 related tools3 chart screenshots
Read
Clean chart structure at a glanceA broader chart image for guides about chart reading, platform workflow, and price-action context.
A practical guide to the best futures platforms for indicator users, comparing charting depth, scripting workflows, and how naturally each platform fits active futures trading.
Decision guideReference articleWorkflow article
Read
Opening range mapped on chartA chart showing the opening range high, low, and midpoint held on screen for early-session context.
A beginner-friendly comparison of TradingView and MetaTrader, with a little more honesty about where each one feels smooth and where it starts to feel heavy.
ComparisonReference articleWorkflow article
Read
ATR bands around a directional moveA 5-minute futures chart with ATR Risk Bands framing the move using upper and lower volatility context.
A practical comparison of NinjaTrader and TradeStation for indicator users deciding between an NT8 futures workflow and a more established EasyLanguage environment.
ComparisonReference articleWorkflow article
Read
ATR bands around a directional moveA 5-minute futures chart with ATR Risk Bands framing the move using upper and lower volatility context.
A practical guide to custom NinjaTrader indicator development, including what to bring to the request, what usually keeps the quote sane, and which changes tend to help most in the real world.
Service guideReference articleWorkflow article
Read
ATR bands around a directional moveA 5-minute futures chart with ATR Risk Bands framing the move using upper and lower volatility context.
A practical guide to moving TradingView ideas into NinjaTrader, including what usually carries over, what tends to break, and when a clean rewrite is the honest answer.
Service guideReference articleWorkflow article
Read
Clean chart structure at a glanceA broader chart image for guides about chart reading, platform workflow, and price-action context.
A practical guide to converting indicators between platforms without pretending the move is automatic, including what usually survives, what needs rewriting, and how to frame a realistic request.
Service guideReference articleWorkflow article
Read
Clean chart structure at a glanceA broader chart image for guides about chart reading, platform workflow, and price-action context.
A practical guide to custom TradeStation indicator development for traders using EasyLanguage workflows who need cleaner alerts, adapted logic, or builds that actually fit the way they already work.
Service guideReference articleWorkflow article
Read
Clean chart structure at a glanceA broader chart image for guides about chart reading, platform workflow, and price-action context.
A practical guide to custom MT4 and MT5 indicator development, including when to modify an existing MQL indicator, when to rebuild it, and how to prepare a request that leads to a usable tool instead of a vague coding ticket.
Service guideReference articleWorkflow article
Read
Clean chart structure at a glanceA broader chart image for guides about chart reading, platform workflow, and price-action context.
A practical guide for traders dealing with indicators that fail to compile, stop plotting correctly, or start acting weird after a platform change, import issue, or code edit.
Service guideReference articleWorkflow article
Read
Clean chart structure at a glanceA broader chart image for guides about chart reading, platform workflow, and price-action context.
A practical guide to converting a TradingView script into MT4 or MT5 without pretending Pine Script moves over automatically, including what to prepare and what usually changes during the port.
Service guideReference articleWorkflow article
Read
Clean chart structure at a glanceA broader chart image for guides about chart reading, platform workflow, and price-action context.
A practical guide to choosing the best platform for futures day traders, with a focus on chart workflow, indicator fit, customization depth, and how the choice affects the daily routine.
Decision guideReference articleWorkflow article
Read
Clean chart structure at a glanceA broader chart image for guides about chart reading, platform workflow, and price-action context.
A practical comparison of prop-firm and personal-account workflows for indicator traders, with attention to drawdown pressure, rule constraints, and how those differences change what a useful setup looks like.
Decision guideReference articleWorkflow article
Read
ATR bands around a directional moveA 5-minute futures chart with ATR Risk Bands framing the move using upper and lower volatility context.
A practical futures-focused comparison of NinjaTrader and TradingView for traders deciding between a deeper desktop workflow and a faster chart-first environment.
ComparisonReference articleWorkflow article
Read
ATR bands around a directional moveA 5-minute futures chart with ATR Risk Bands framing the move using upper and lower volatility context.
A practical guide to whether a Pine Script can be converted to NinjaScript, what usually carries over well, and where traders should expect differences instead of exact one-to-one behavior.
Conversion guideReference articleWorkflow article
Read
Clean chart structure at a glanceA broader chart image for guides about chart reading, platform workflow, and price-action context.
A practical guide to converting EasyLanguage to PowerLanguage, including when the move is straightforward, where hidden differences still matter, and how to scope the work honestly.
Conversion guideReference articleWorkflow article
Read
Prior-session references on chartA chart showing session reference lines such as prior levels and the session open held in view during live trade.
A practical guide to breakout indicators for traders who want a cleaner read on opening drive levels, rolling range edges, and participation behind expansion.
Breakouts4 related tools4 chart screenshots
Read
Session VWAP on a live chartA chart capture showing Session VWAP anchored to the trading day for intraday fair-value context.
A direct comparison between a steady session-reset VWAP and a faster exponential VWAP for traders deciding how quickly their fair-value reference should respond.
Comparison2 related tools2 chart screenshots
Read
Psychological levels on chartA chart showing Round Number Levels marking clean psychological price intervals.
A practical guide to trend-following indicators for traders who want cleaner pullback context, trend-state confirmation, and more disciplined chart structure.
Trend4 related tools4 chart screenshots
Read
Prior-session references on chartA chart showing session reference lines such as prior levels and the session open held in view during live trade.
A guide to support and resistance indicators for active intraday traders who want cleaner session references, psychological levels, and practical chart maps.
Levels4 related tools4 chart screenshots
Read
Session VWAP on a live chartA chart capture showing Session VWAP anchored to the trading day for intraday fair-value context.
A practical guide to using consecutive bars counts for exhaustion, continuation, and cleaner short-term price-action reads.
Price action3 related tools3 chart screenshots
Read
Retracement levels on a live chartA chart showing the recent swing range with automatic Fibonacci retracement levels held on screen for pullback reference.
A guide to market structure indicators in NinjaTrader, including swing labels, confirmation delay, and trend-state context.
Market structure2 related tools2 chart screenshots
Read
Structure and divergence contextA broader chart image used where guide or category pages need a stronger visual anchor around structure, reversal, or pattern reading.
When a faster exponential VWAP-style line is more useful than a standard session VWAP, and when the extra responsiveness becomes noise.
Comparison2 related tools2 chart screenshots
Read
Prior-session references on chartA chart showing session reference lines such as prior levels and the session open held in view during live trade.
How swing-label tools differ from simple bar-pattern markers, and why they help with different parts of a price-action workflow.
Comparison2 related tools2 chart screenshots
Read
Recent range boundaries on chartA chart showing Donchian Channels defining the current breakout and pullback envelope from the recent lookback range.
How to think about a NinjaTrader volume spike indicator, including threshold tuning, feed differences, and when a spike is actually worth caring about.
Volume spike2 related tools2 chart screenshots
Read
Opening range mapped on chartA chart showing the opening range high, low, and midpoint held on screen for early-session context.
A direct answer for traders trying to import NinjaTrader 8 indicator ZIP files without wrecking an existing workspace.
Install guide2 related tools2 chart screenshots
Read
Prior-session references on chartA chart showing session reference lines such as prior levels and the session open held in view during live trade.
Occasional notes when something useful is worth your time
Uses Constant Contact for email delivery. Expect occasional updates about new indicators, important library changes,
and practical futures workflow notes. Review the privacy policy.