What it does
Breakeven Stop Line is a practical risk-management overlay for traders who want a live visual reference for the point where a trade is no longer losing after costs. It is designed to support decision quality, not to tell the trader when breakeven is always the right move.
Who this is for
This page is a good fit for traders who want a readable Breakeven Stop Line workflow without having to reverse-engineer the setup from forum posts or screenshots.
Key terms for this tool
Review the core trading and platform terms tied to this page before changing settings or using the study in a live workspace.
What it is not
Breakeven Stop Line is a chart-context tool. It does not place trades, manage risk automatically, or promise that a specific pattern will resolve in one direction. Use it to organize decisions, not to outsource them.
Chart examples
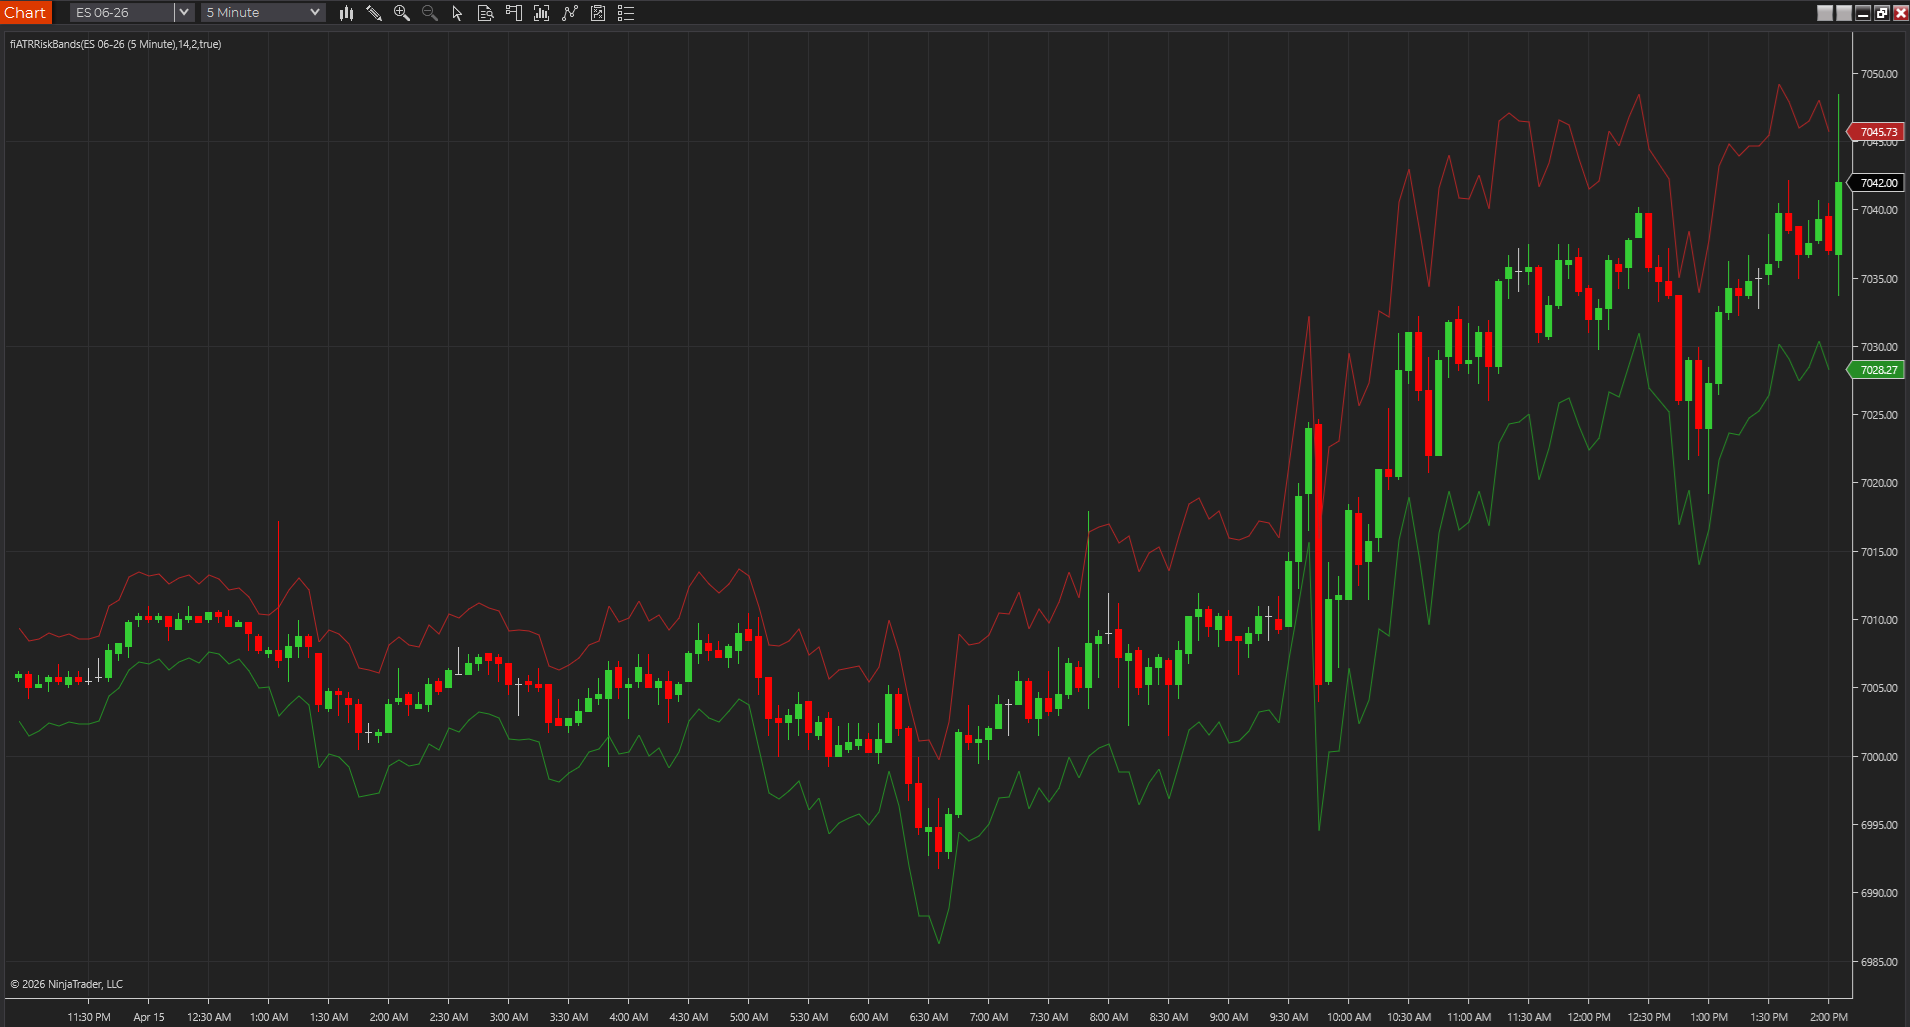
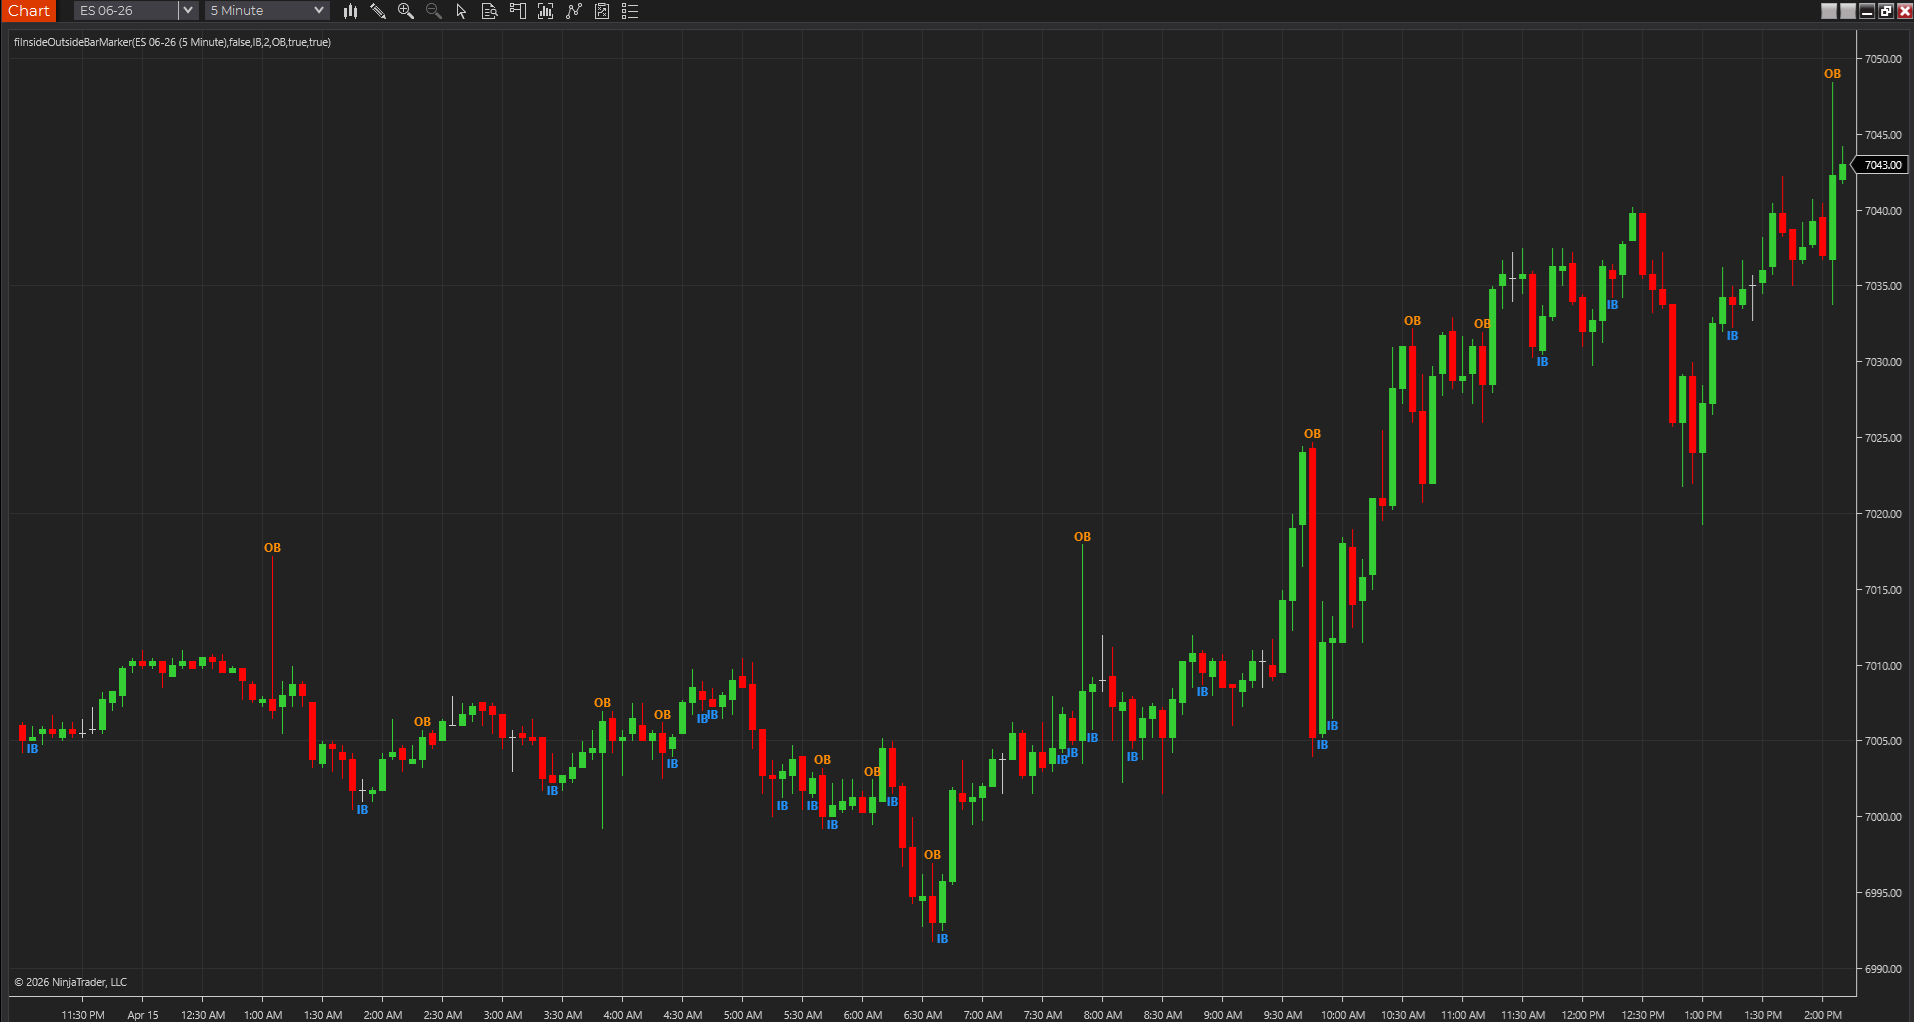
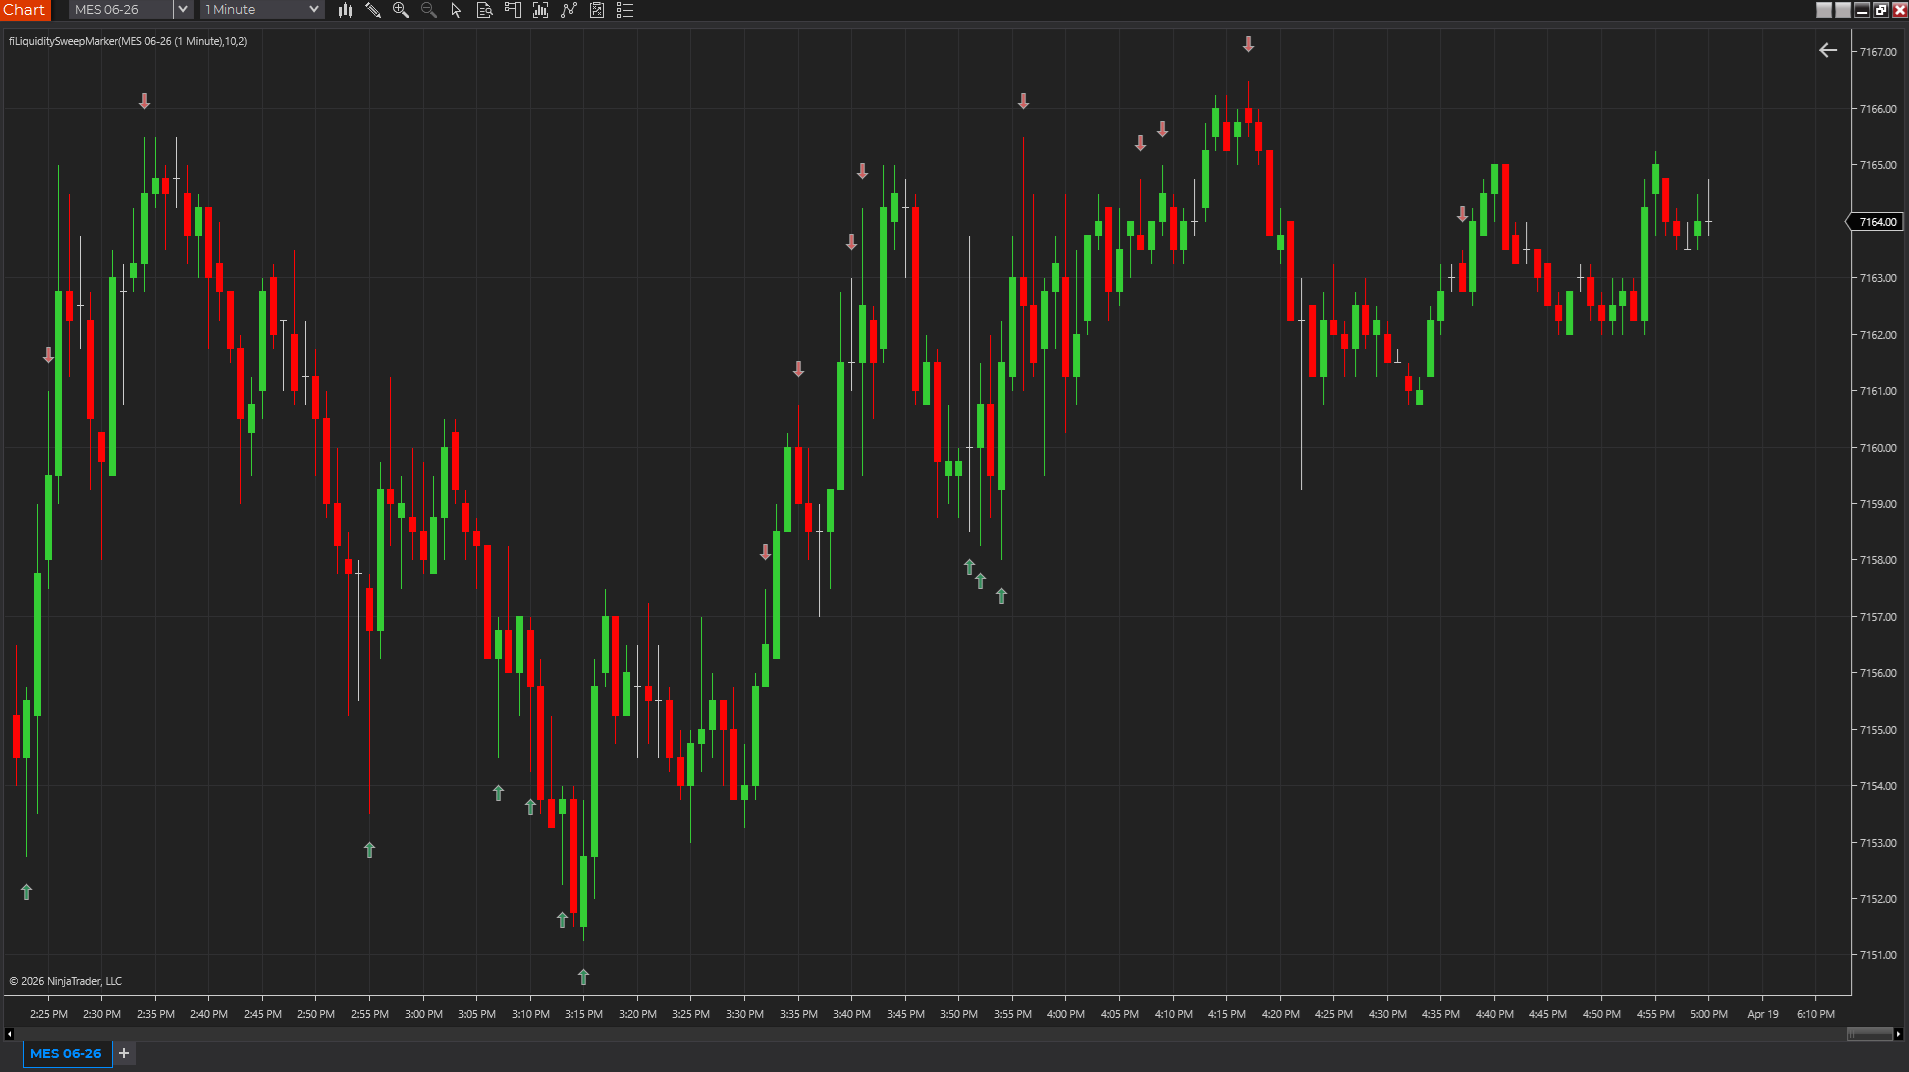
This chart capture shows the study on a real NinjaTrader workspace. Use it as visual reference, then confirm behavior on your own instrument, session, and timeframe.
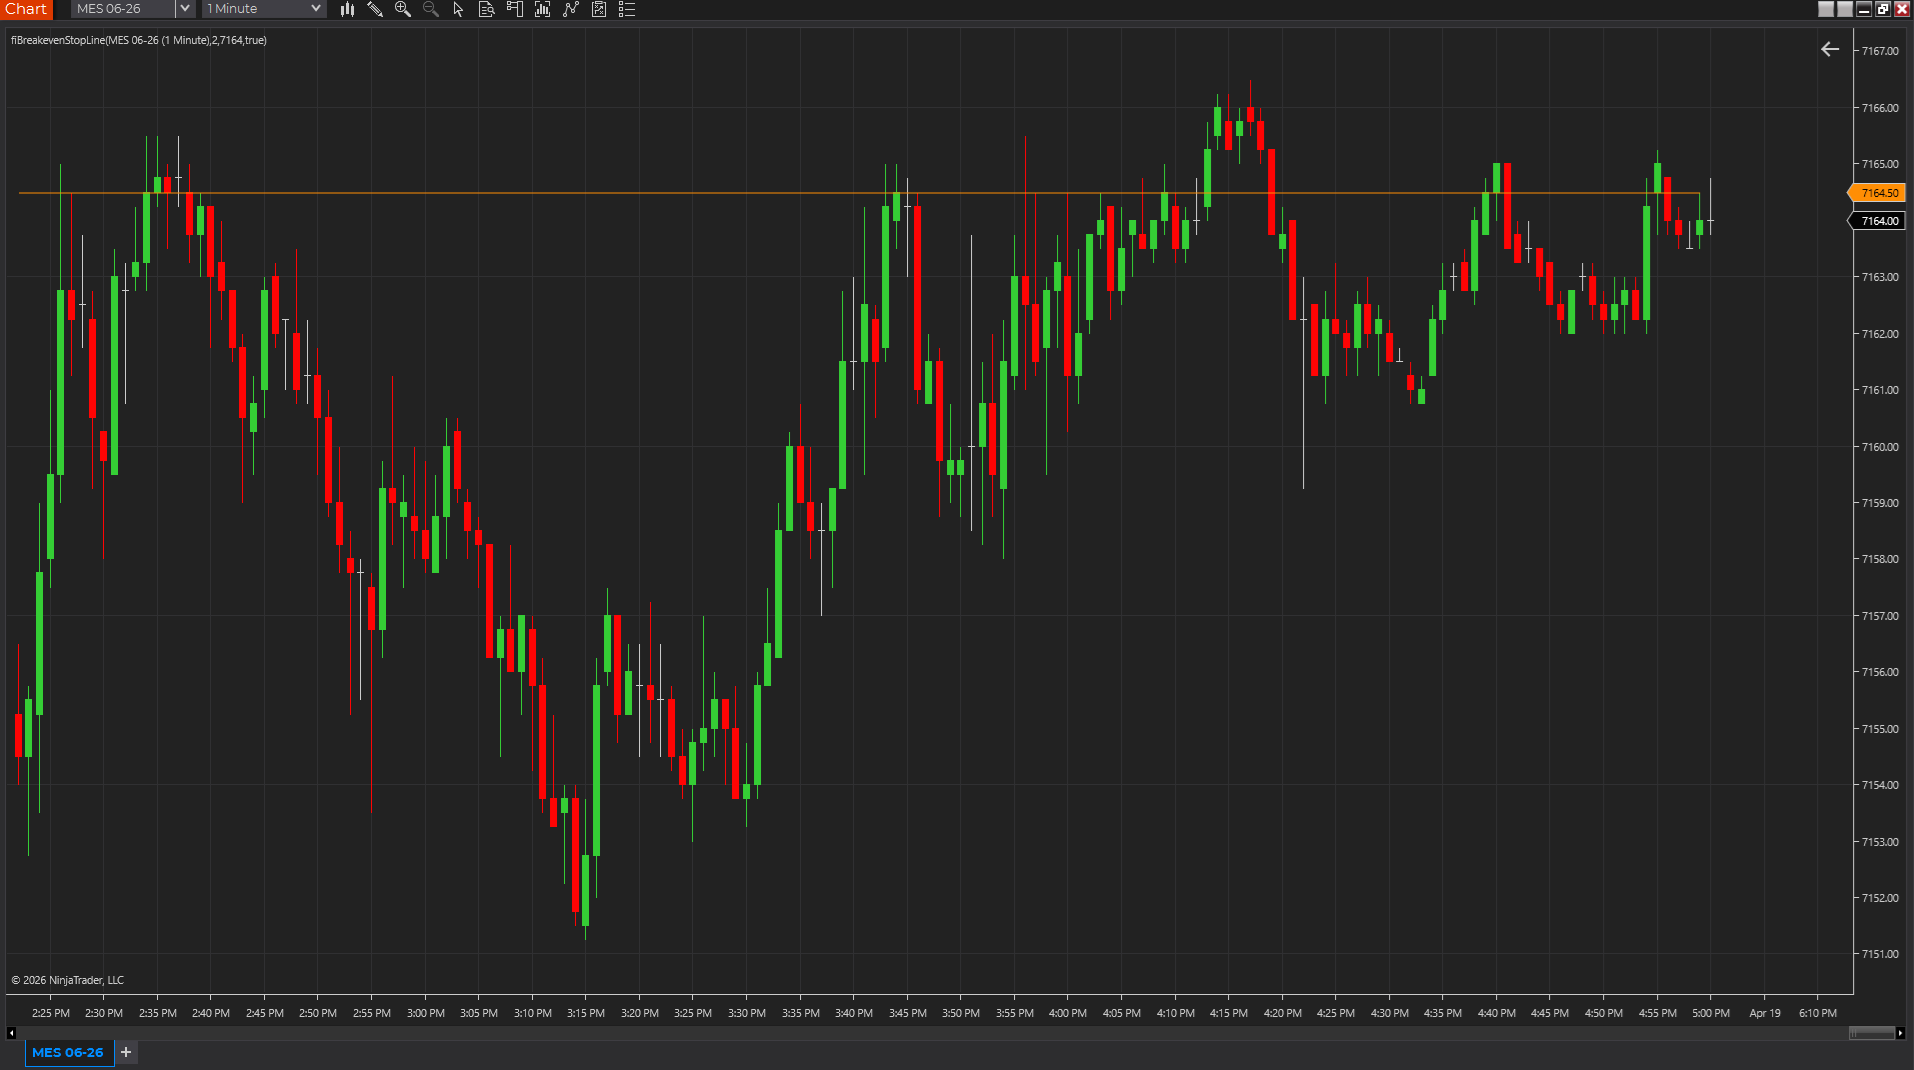
Breakeven line on chart
A chart showing Breakeven Stop Line keeping the current cost-adjusted breakeven reference visible on price.
Best fit
- Keeping stop movement decisions tied to real cost context.
- Visualizing whether a trade has actually earned the right to move to breakeven.
- Reviewing how often breakeven logic would have helped or hurt the workflow.
Before using it live
- Import the NinjaTrader 8 ZIP through NinjaTrader's normal import flow, or use the source block for another platform and compile it as a chart overlay.
- Enter realistic cost assumptions before using the line in live trade management.
- Review the line on both long and short examples so the offset behavior is obvious.
- Review how the tool behaves on your actual session template, chart type, and instrument.
Settings to review
Sets the base trade entry used to calculate the breakeven reference.
Adds commission, slippage, or tick-cost assumptions to the line.
Flips the breakeven offset direction for long versus short trade planning.
Controls the breakeven line color on the chart.
Installation notes
- Import the NinjaTrader 8 ZIP through NinjaTrader's normal import flow, or use the source block for another platform and compile it as a chart overlay.
- Enter realistic cost assumptions before using the line in live trade management.
- Review the line on both long and short examples so the offset behavior is obvious.
Downloads
After the download
Keep the next step tied to this exact tool
Install it cleanly, subscribe for future updates if this workflow matters, or move straight into a structured request if the tool needs another platform or a custom version.
Install guide
Keep the workspace stable
Use the clean import flow before a promising download turns into a platform cleanup project.
Open install guideEmail follow-up
Get updates if this tool changes
Use the email signup if you want future indicator and workflow updates without checking back manually.
Join updatesPaid priority
Escalate when the free file is not enough
Best fit for ports, urgent fixes, or workflow-specific custom work that should not wait in the normal queue.
Open request formSource code
These source examples are provided for copy/paste workflows on other charting platforms. Review and test any script in a simulator before using it on a live chart.
{
  Breakeven Stop Line
  FreeIndicators.com source example.
  Works as a starting point for TradeStation EasyLanguage and MultiCharts PowerLanguage.
}

Inputs: EntryPrice(0), CostTicks(2), TickSize(0.25), IsLong(True);
Vars: Breakeven(0);

Breakeven = EntryPrice + IFF(IsLong, CostTicks * TickSize, -CostTicks * TickSize);
Plot1(Breakeven, "Breakeven");// Breakeven Stop Line
// FreeIndicators.com source example for MetaTrader 4.
#property indicator_chart_window
#property indicator_buffers 3
#property indicator_color1 DodgerBlue
#property indicator_color2 Crimson
#property indicator_color3 SeaGreen
double Buffer1[];
double Buffer2[];
double Buffer3[];
int init() {
SetIndexBuffer(0, Buffer1);
SetIndexBuffer(1, Buffer2);
SetIndexBuffer(2, Buffer3);
return(0);
}
int start() {
int counted = IndicatorCounted();
int limit = Bars - counted - 1;
double entryPrice = Close[0];
double costTicks = 2.0;
double tickSize = Point;
bool isLongTrade = true;
for(int i = limit; i >= 0; i--) {
double offset = costTicks * tickSize;
Buffer1[i] = entryPrice + (isLongTrade ? offset : -offset);
}
return(0);
}// Breakeven Stop Line
// FreeIndicators.com source example for MetaTrader 5.
#property indicator_chart_window
#property indicator_buffers 3
#property indicator_plots 3
double Buffer1[];
double Buffer2[];
double Buffer3[];
int OnInit() {
SetIndexBuffer(0, Buffer1, INDICATOR_DATA);
SetIndexBuffer(1, Buffer2, INDICATOR_DATA);
SetIndexBuffer(2, Buffer3, INDICATOR_DATA);
return(INIT_SUCCEEDED);
}
int OnCalculate(const int rates_total,
const int prev_calculated,
const datetime &time[],
const double &open[],
const double &high[],
const double &low[],
const double &close[],
const long &tick_volume[],
const long &volume[],
const int &spread[]) {
int start = prev_calculated > 1 ? prev_calculated - 1 : 1;
double entryPrice = close[0];
double costTicks = 2.0;
double tickSize = _Point;
bool isLongTrade = true;
for(int i = start; i < rates_total; i++) {
double offset = costTicks * tickSize;
Buffer1[i] = entryPrice + (isLongTrade ? offset : -offset);
}
return(rates_total);
}//@version=5
indicator("Breakeven Stop Line", overlay=true)
entryPrice = input.float(close, "Entry price")
costTicks = input.float(2.0, "Cost ticks")
tickSize = input.float(syminfo.mintick, "Tick size")
isLong = input.bool(true, "Long trade")
breakeven = entryPrice + (isLong ? costTicks * tickSize : -costTicks * tickSize)
plot(breakeven, "Breakeven", color=color.orange, linewidth=2)Limitations
- Breakeven is a management choice, not an automatic improvement.
- Poor cost assumptions can make the line misleading.
- The line does not replace position sizing or invalidation planning.
Frequently asked questions
Does it repaint?
This indicator is designed as a chart reference tool, not as a hindsight-only backfitted signal. Even so, you should still test it bar by bar on your chart type to confirm how it behaves on the active bar.
Which platforms are covered?
NinjaTrader 8, TradeStation EasyLanguage, MultiCharts PowerLanguage, MetaTrader 4, MetaTrader 5, TradingView Pine Script are currently represented through downloads or source pages.
Is source code included?
Yes. This page includes source examples or links to platform-specific source pages where applicable.