What it does
Opening Range Levels gives the session open a simple, visible structure map. It is most useful for traders who want to frame the early range cleanly before adding confirmation tools or breakout logic.
Who this is for
This page is a good fit for traders who want a readable Opening Range Levels workflow without having to reverse-engineer the setup from forum posts or screenshots.
Key terms for this tool
Review the core trading and platform terms tied to this page before changing settings or using the study in a live workspace.
What it is not
Opening Range Levels is a chart-context tool. It does not place trades, manage risk automatically, or promise that a specific pattern will resolve in one direction. Use it to organize decisions, not to outsource them.
Chart examples
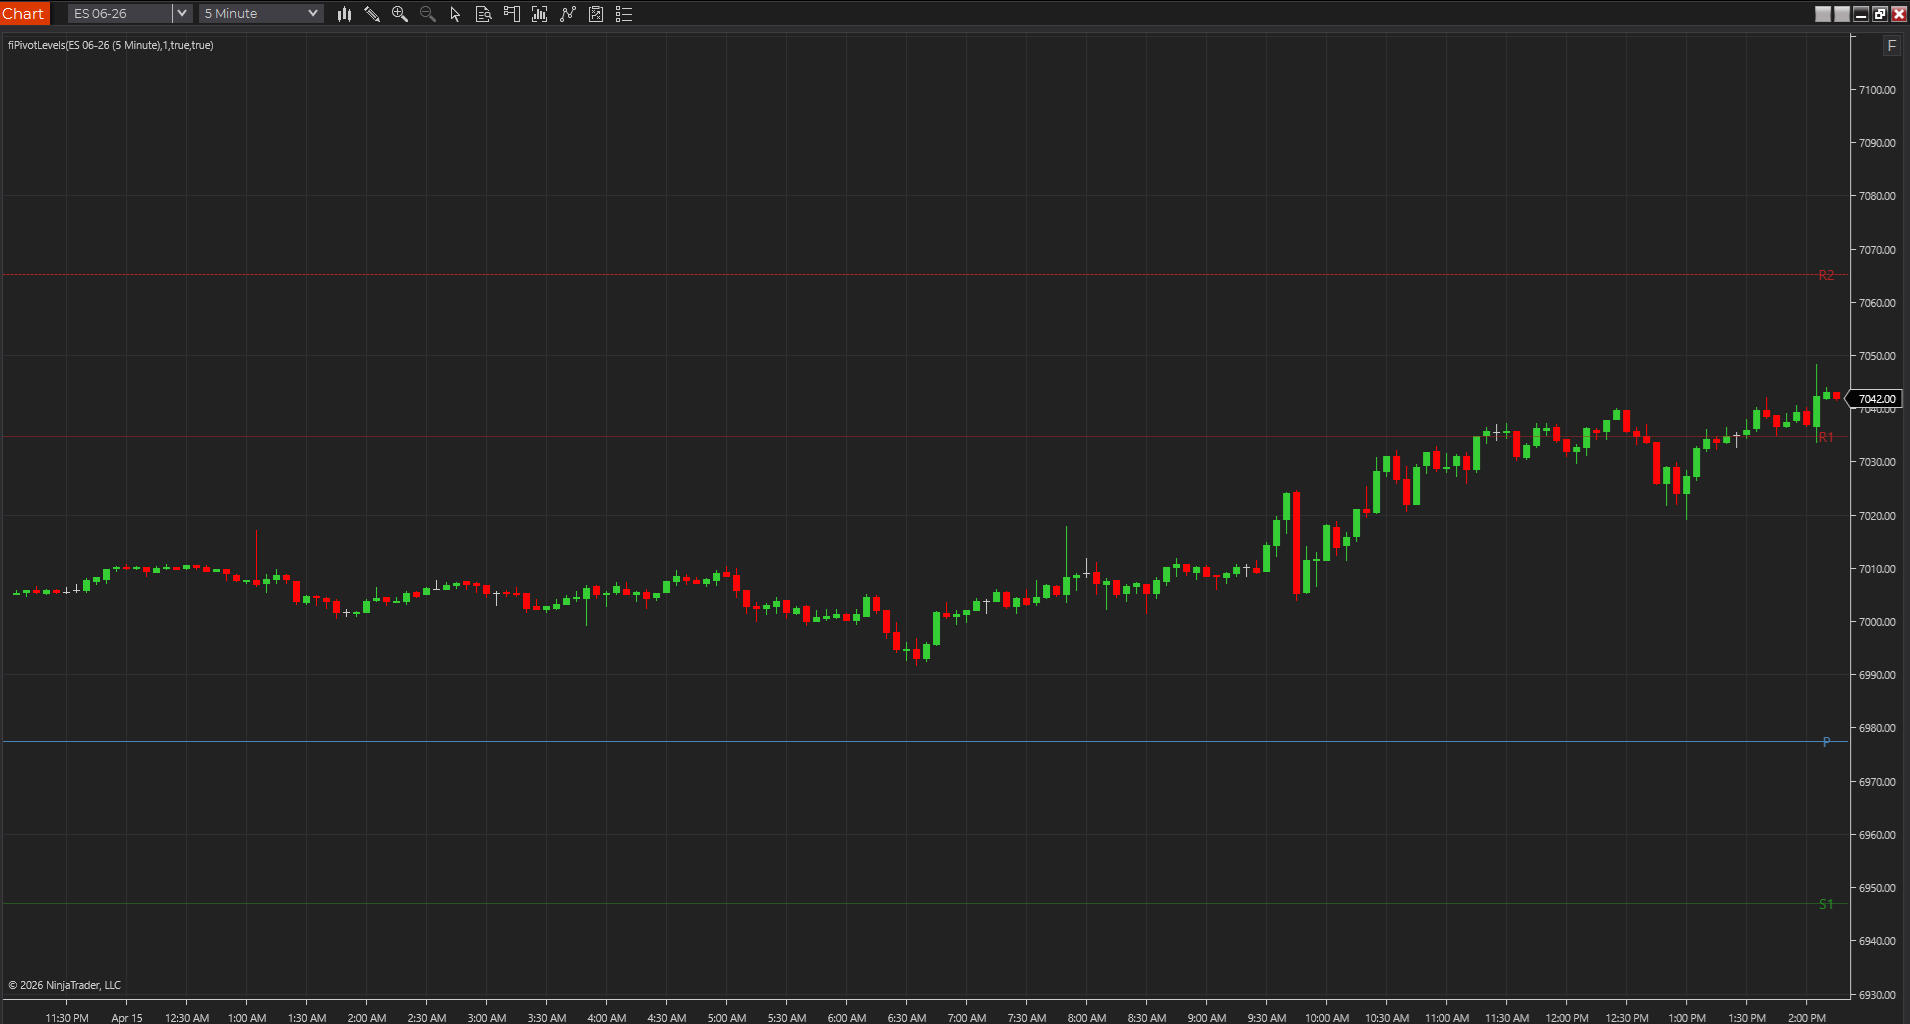
This chart capture shows the study on a real NinjaTrader workspace. Use it as visual reference, then confirm behavior on your own instrument, session, and timeframe.
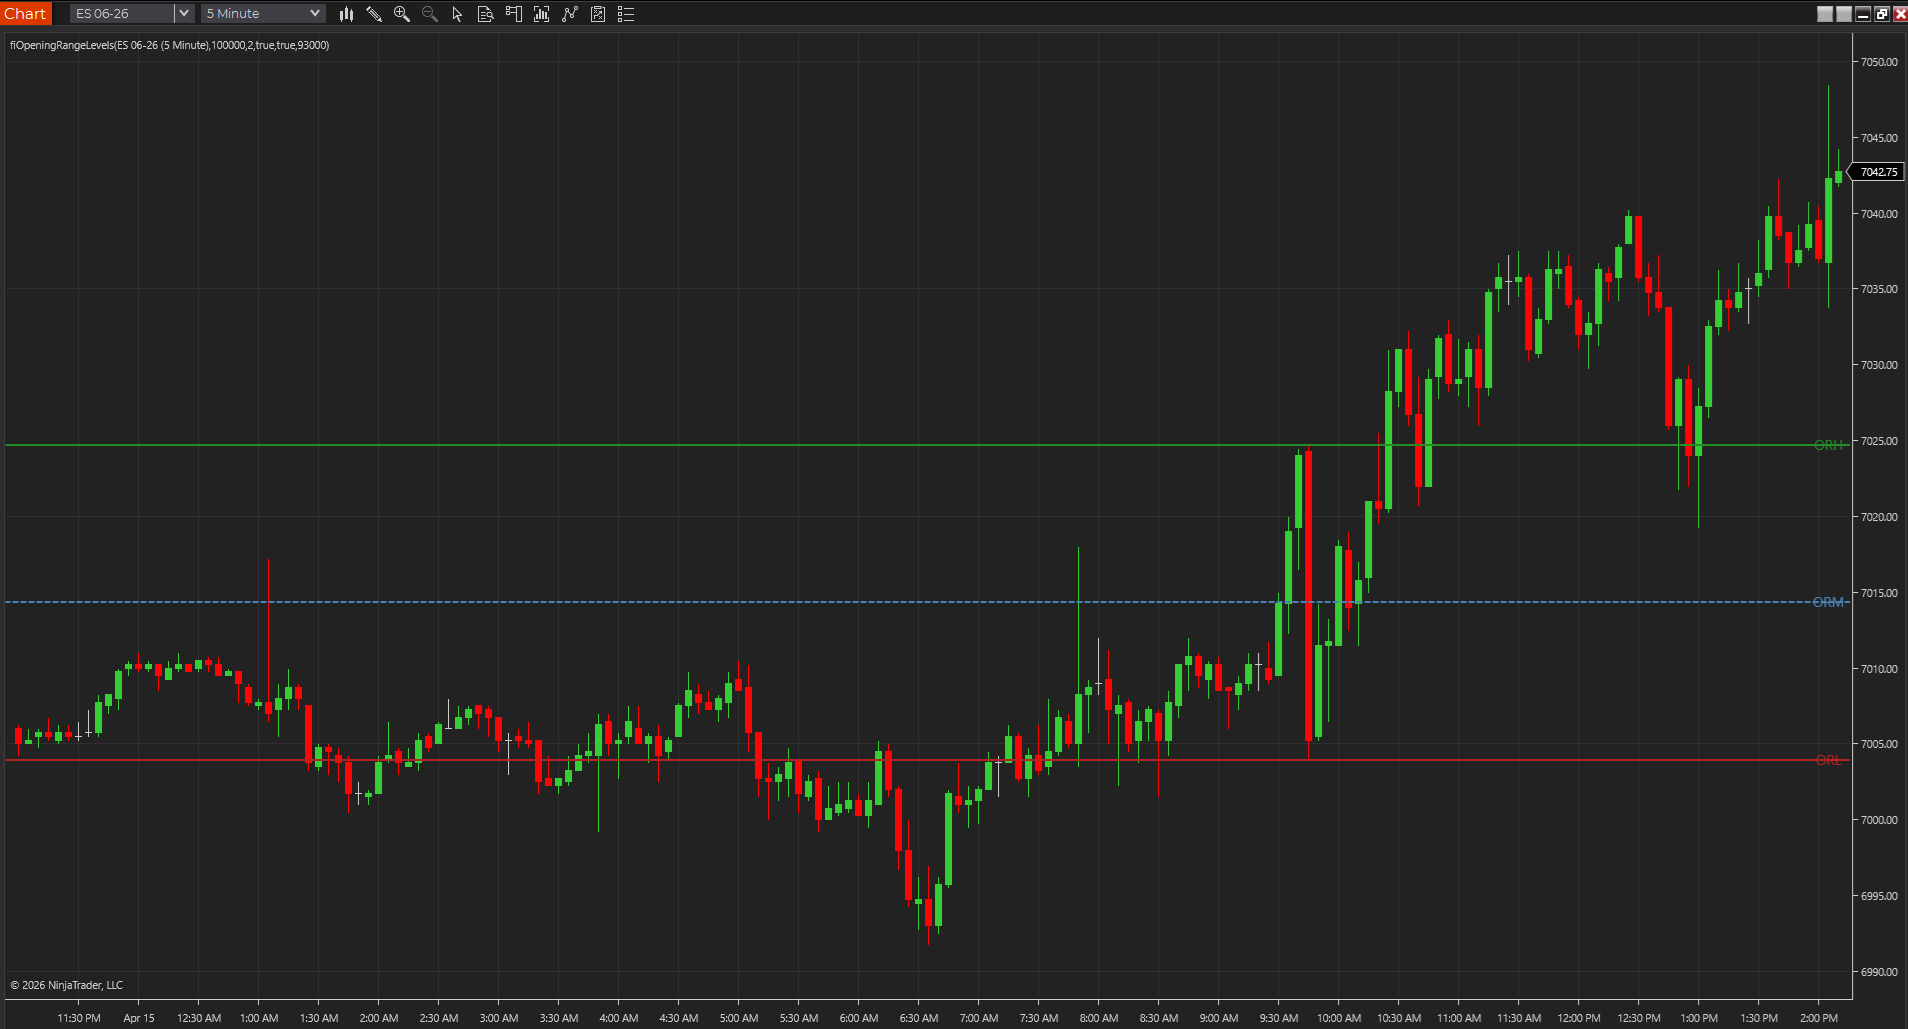
Opening range mapped on chart
A chart showing the opening range high, low, and midpoint held on screen for early-session context.
Best fit
- Framing the first meaningful session boundaries.
- Comparing later breakouts or failures against the opening map.
- Using the midpoint as a quick read on early-session balance.
Before using it live
- Import the NinjaTrader 8 ZIP through NinjaTrader's normal import flow.
- Set the opening range times to match the session you actually trade.
- Use it first on a clean chart so the opening boundaries stay obvious.
- Review how the tool behaves on your actual session template, chart type, and instrument.
Settings to review
Defines when the opening range begins.
Defines when the opening range stops collecting bars.
Adds the opening range midpoint as a lighter reference.
Installation notes
- Import the NinjaTrader 8 ZIP through NinjaTrader's normal import flow.
- Set the opening range times to match the session you actually trade.
- Use it first on a clean chart so the opening boundaries stay obvious.
Downloads
After the download
Keep the next step tied to this exact tool
Install it cleanly, subscribe for future updates if this workflow matters, or move straight into a structured request if the tool needs another platform or a custom version.
Install guide
Keep the workspace stable
Use the clean import flow before a promising download turns into a platform cleanup project.
Open install guideEmail follow-up
Get updates if this tool changes
Use the email signup if you want future indicator and workflow updates without checking back manually.
Join updatesPaid priority
Escalate when the free file is not enough
Best fit for ports, urgent fixes, or workflow-specific custom work that should not wait in the normal queue.
Open request formSource code
These source examples are provided for copy/paste workflows on other charting platforms. Review and test any script in a simulator before using it on a live chart.
{
  Opening Range Levels
  FreeIndicators.com source example.
  Works as a starting point for TradeStation EasyLanguage and MultiCharts PowerLanguage.
}

Inputs: StartTime(0930), EndTime(1000);
Vars: ORHigh(0), ORLow(0), Collecting(False);

If Date <> Date[1] Then Begin
  ORHigh = High;
  ORLow = Low;
  Collecting = False;
End;

If Time >= StartTime And Time <= EndTime Then Begin
  Collecting = True;
  ORHigh = MaxList(ORHigh, High);
  ORLow = MinList(ORLow, Low);
End;

If Collecting And Time > EndTime Then Begin
  Plot1(ORHigh, "ORH");
  Plot2(ORLow, "ORL");
  Plot3((ORHigh + ORLow) / 2, "ORM");
End;// Opening Range Levels
// FreeIndicators.com source example for MetaTrader 4.
#property indicator_chart_window
#property indicator_buffers 3
#property indicator_color1 DodgerBlue
#property indicator_color2 Crimson
#property indicator_color3 SeaGreen
double Buffer1[];
double Buffer2[];
double Buffer3[];
int init() {
SetIndexBuffer(0, Buffer1);
SetIndexBuffer(1, Buffer2);
SetIndexBuffer(2, Buffer3);
return(0);
}
int start() {
int counted = IndicatorCounted();
int limit = Bars - counted - 1;
int startTime = 93000, endTime = 100000;
double orHigh = 0, orLow = 0;
for(int i = limit; i >= 0; i--) {
int t = TimeHour(Time[i]) * 10000 + TimeMinute(Time[i]) * 100;
if(t >= startTime && t <= endTime) {
orHigh = MathMax(orHigh == 0 ? High[i] : orHigh, High[i]);
orLow = MathMin(orLow == 0 ? Low[i] : orLow, Low[i]);
}
Buffer1[i] = orHigh;
Buffer2[i] = orLow;
Buffer3[i] = (orHigh + orLow) / 2.0;
}
return(0);
}// Opening Range Levels
// FreeIndicators.com source example for MetaTrader 5.
#property indicator_chart_window
#property indicator_buffers 3
#property indicator_plots 3
double Buffer1[];
double Buffer2[];
double Buffer3[];
int OnInit() {
SetIndexBuffer(0, Buffer1, INDICATOR_DATA);
SetIndexBuffer(1, Buffer2, INDICATOR_DATA);
SetIndexBuffer(2, Buffer3, INDICATOR_DATA);
return(INIT_SUCCEEDED);
}
int OnCalculate(const int rates_total,
const int prev_calculated,
const datetime &time[],
const double &open[],
const double &high[],
const double &low[],
const double &close[],
const long &tick_volume[],
const long &volume[],
const int &spread[]) {
int start = prev_calculated > 1 ? prev_calculated - 1 : 1;
int startTime = 93000, endTime = 100000;
double orHigh = 0, orLow = 0;
for(int i = start; i < rates_total; i++) {
MqlDateTime dt; TimeToStruct(time[i], dt);
int t = dt.hour * 10000 + dt.min * 100;
if(t >= startTime && t <= endTime) {
orHigh = MathMax(orHigh == 0 ? high[i] : orHigh, high[i]);
orLow = MathMin(orLow == 0 ? low[i] : orLow, low[i]);
}
Buffer1[i] = orHigh;
Buffer2[i] = orLow;
Buffer3[i] = (orHigh + orLow) / 2.0;
}
return(rates_total);
}//@version=5
indicator("Opening Range Levels", overlay=true)
startHour = input.int(9, "Start hour")
startMinute = input.int(30, "Start minute")
endHour = input.int(10, "End hour")
endMinute = input.int(0, "End minute")
inRange = (hour > startHour or hour == startHour and minute >= startMinute) and (hour < endHour or hour == endHour and minute <= endMinute)
newDay = ta.change(time("D"))
var float orHigh = na
var float orLow = na
orHigh := newDay ? na : inRange ? math.max(nz(orHigh, high), high) : orHigh
orLow := newDay ? na : inRange ? math.min(nz(orLow, low), low) : orLow
plot(orHigh, "OR High", color=color.green)
plot(orLow, "OR Low", color=color.red)
plot((orHigh + orLow) / 2, "OR Mid", color=color.blue)Limitations
- It only matters if the session open is meaningful to your workflow.
- Different session definitions can change the range substantially.
- The levels frame structure, but they do not confirm the breakout for you.
Frequently asked questions
Does it repaint?
This indicator is designed as a chart reference tool, not as a hindsight-only backfitted signal. Even so, you should still test it bar by bar on your chart type to confirm how it behaves on the active bar.
Which platforms are covered?
NinjaTrader 8, TradeStation EasyLanguage, MultiCharts PowerLanguage, MetaTrader 4, MetaTrader 5, TradingView Pine Script are currently represented through downloads or source pages.
Is source code included?
Yes. This page includes source examples or links to platform-specific source pages where applicable.