What it does
Delta Imbalance Histogram in this library is a simplified pressure study, not a true bid-versus-ask delta feed. It uses candle body, total range, and volume to build a smoothed directional-pressure histogram that can be compared against price action and location.
Who this is for
This page is best for traders who are comfortable testing settings, comparing workflows, and validating platform behavior before relying on the output.
Key terms for this tool
Review the core trading and platform terms tied to this page before changing settings or using the study in a live workspace.
What it is not
Delta Imbalance Histogram is a chart-context tool. It does not place trades, manage risk automatically, or promise that a specific pattern will resolve in one direction. Use it to organize decisions, not to outsource them.
Chart examples
This chart capture shows the study on a real NinjaTrader workspace. Use it as visual reference, then confirm behavior on your own instrument, session, and timeframe.
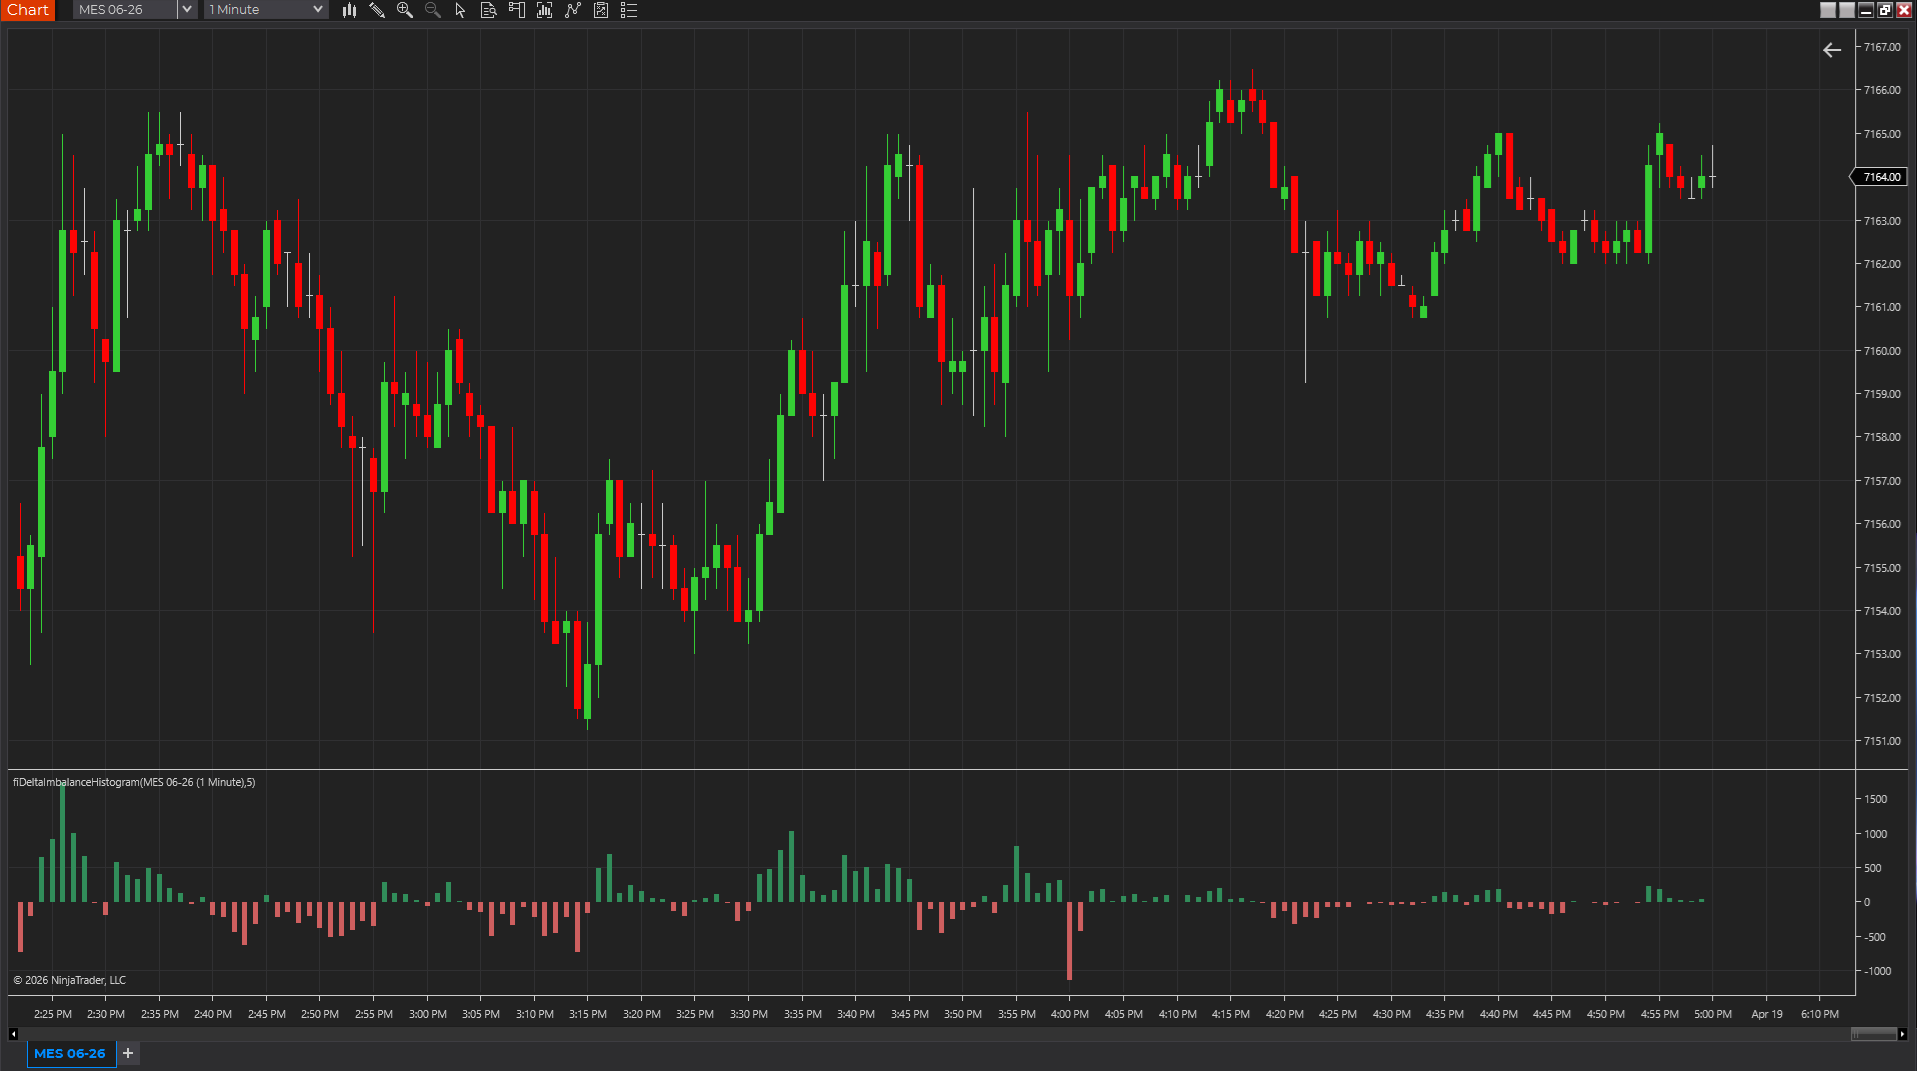
Directional pressure histogram
A chart with Delta Imbalance Histogram using a smoothed body-range-volume pressure proxy in a separate panel.
Best fit
- Checking whether a breakout is showing persistent directional pressure.
- Comparing price extension with a simplified body-range-volume proxy.
- Filtering weak pushes that are not backed by sustained momentum.
Before using it live
- Import the NinjaTrader 8 ZIP through NinjaTrader's normal import flow, or compile the source block for another platform in a separate panel.
- Treat the histogram as a directional-pressure proxy rather than a true order-flow delta feed.
- Compare the histogram against price location instead of reading every positive bar as bullish.
- Review how the tool behaves on your actual session template, chart type, and instrument.
Settings to review
Controls the EMA-style smoothing used on the directional pressure value.
Sets the plot color when smoothed pressure is above zero.
Sets the plot color when smoothed pressure is below zero.
Installation notes
- Import the NinjaTrader 8 ZIP through NinjaTrader's normal import flow, or compile the source block for another platform in a separate panel.
- Treat the histogram as a directional-pressure proxy rather than a true order-flow delta feed.
- Compare the histogram against price location instead of reading every positive bar as bullish.
Downloads
After the download
Keep the next step tied to this exact tool
Install it cleanly, subscribe for future updates if this workflow matters, or move straight into a structured request if the tool needs another platform or a custom version.
Install guide
Keep the workspace stable
Use the clean import flow before a promising download turns into a platform cleanup project.
Open install guideEmail follow-up
Get updates if this tool changes
Use the email signup if you want future indicator and workflow updates without checking back manually.
Join updatesPaid priority
Escalate when the free file is not enough
Best fit for ports, urgent fixes, or workflow-specific custom work that should not wait in the normal queue.
Open request formSource code
These source examples are provided for copy/paste workflows on other charting platforms. Review and test any script in a simulator before using it on a live chart.
{
  Delta Imbalance Histogram
  FreeIndicators.com source example.
  Works as a starting point for TradeStation EasyLanguage and MultiCharts PowerLanguage.
}

Inputs: Smoothing(5);
Vars: RangeValue(0), BodyValue(0), Pressure(0), Alpha(0), Imbalance(0);

RangeValue = MaxList(MinMove / PriceScale, High - Low);
BodyValue = Close - Open;
Pressure = (BodyValue / RangeValue) * MaxList(1, Volume);
Alpha = 2 / (Smoothing + 1);
Imbalance = IFF(CurrentBar = 1, Pressure, Imbalance[1] + Alpha * (Pressure - Imbalance[1]));

Plot1(Imbalance, "Imbalance");// Delta Imbalance Histogram
// FreeIndicators.com source example for MetaTrader 4.
#property indicator_chart_window
#property indicator_buffers 3
#property indicator_color1 DodgerBlue
#property indicator_color2 Crimson
#property indicator_color3 SeaGreen
double Buffer1[];
double Buffer2[];
double Buffer3[];
int init() {
SetIndexBuffer(0, Buffer1);
SetIndexBuffer(1, Buffer2);
SetIndexBuffer(2, Buffer3);
return(0);
}
int start() {
int counted = IndicatorCounted();
int limit = Bars - counted - 1;
int smoothing = 5;
double alpha = 2.0 / (smoothing + 1.0);
double smoothed = 0;
for(int i = Bars - 1; i >= 0; i--) {
double range = MathMax(Point, High[i] - Low[i]);
double body = Close[i] - Open[i];
double pressure = (body / range) * MathMax(1.0, Volume[i]);
smoothed = (i == Bars - 1) ? pressure : smoothed + alpha * (pressure - smoothed);
Buffer1[i] = smoothed;
}
return(0);
}// Delta Imbalance Histogram
// FreeIndicators.com source example for MetaTrader 5.
#property indicator_chart_window
#property indicator_buffers 3
#property indicator_plots 3
double Buffer1[];
double Buffer2[];
double Buffer3[];
int OnInit() {
SetIndexBuffer(0, Buffer1, INDICATOR_DATA);
SetIndexBuffer(1, Buffer2, INDICATOR_DATA);
SetIndexBuffer(2, Buffer3, INDICATOR_DATA);
return(INIT_SUCCEEDED);
}
int OnCalculate(const int rates_total,
const int prev_calculated,
const datetime &time[],
const double &open[],
const double &high[],
const double &low[],
const double &close[],
const long &tick_volume[],
const long &volume[],
const int &spread[]) {
int start = prev_calculated > 1 ? prev_calculated - 1 : 1;
int smoothing = 5;
double alpha = 2.0 / (smoothing + 1.0);
double smoothed = 0;
for(int i = 0; i < rates_total; i++) {
double range = MathMax(_Point, high[i] - low[i]);
double body = close[i] - open[i];
double pressure = (body / range) * MathMax(1.0, (double)tick_volume[i]);
smoothed = (i == 0) ? pressure : smoothed + alpha * (pressure - smoothed);
Buffer1[i] = smoothed;
}
return(rates_total);
}//@version=5
indicator("Delta Imbalance Histogram", overlay=true)
smoothing = input.int(5, "Smoothing", minval=1)
rangeValue = math.max(syminfo.mintick, high - low)
bodyValue = close - open
pressure = (bodyValue / rangeValue) * math.max(1.0, volume)
imbalance = ta.ema(pressure, smoothing)
plot(imbalance, "Imbalance", color=imbalance >= 0 ? color.green : color.red, style=plot.style_columns)
hline(0, "Zero", color=color.gray)Limitations
- This is not true bid-ask delta and does not require footprint data.
- Some platforms only approximate directional pressure rather than measure aggressive flow directly.
- A strong imbalance can still appear near exhaustion.
Frequently asked questions
Does it repaint?
This indicator is designed as a chart reference tool, not as a hindsight-only backfitted signal. Even so, you should still test it bar by bar on your chart type to confirm how it behaves on the active bar.
Which platforms are covered?
NinjaTrader 8, TradeStation EasyLanguage, MultiCharts PowerLanguage, MetaTrader 4, MetaTrader 5, TradingView Pine Script are currently represented through downloads or source pages.
Is source code included?
Yes. This page includes source examples or links to platform-specific source pages where applicable.