Category hub
VWAP Indicators
Free VWAP-style indicator pages, source examples, and comparison guides for traders who want cleaner fair-value context.
Open hubIndicator library
Browse real trading tools by platform, workflow, and skill level. Each product page includes practical notes, live chart captures, downloads when available, and source examples where they exist.
Featured workflows
Category hub
Free VWAP-style indicator pages, source examples, and comparison guides for traders who want cleaner fair-value context.
Open hubCategory hub
Indicator pages and source examples for traders who want to track participation, activity bursts, and tempo without cluttering the chart.
Open hubCategory hub
A category hub for opening range, inside bar, breakout, and channel tools that organize price action without pretending to be a trade plan.
Open hubCategory hub
Hub pages for prior-session references, pivots, retracement levels, and other chart tools that keep important prices visible.
Open hubCategory hub
A hub for swing labels, trend-state tools, ribbons, and related pages that help traders read structure without overfitting the chart.
Open hub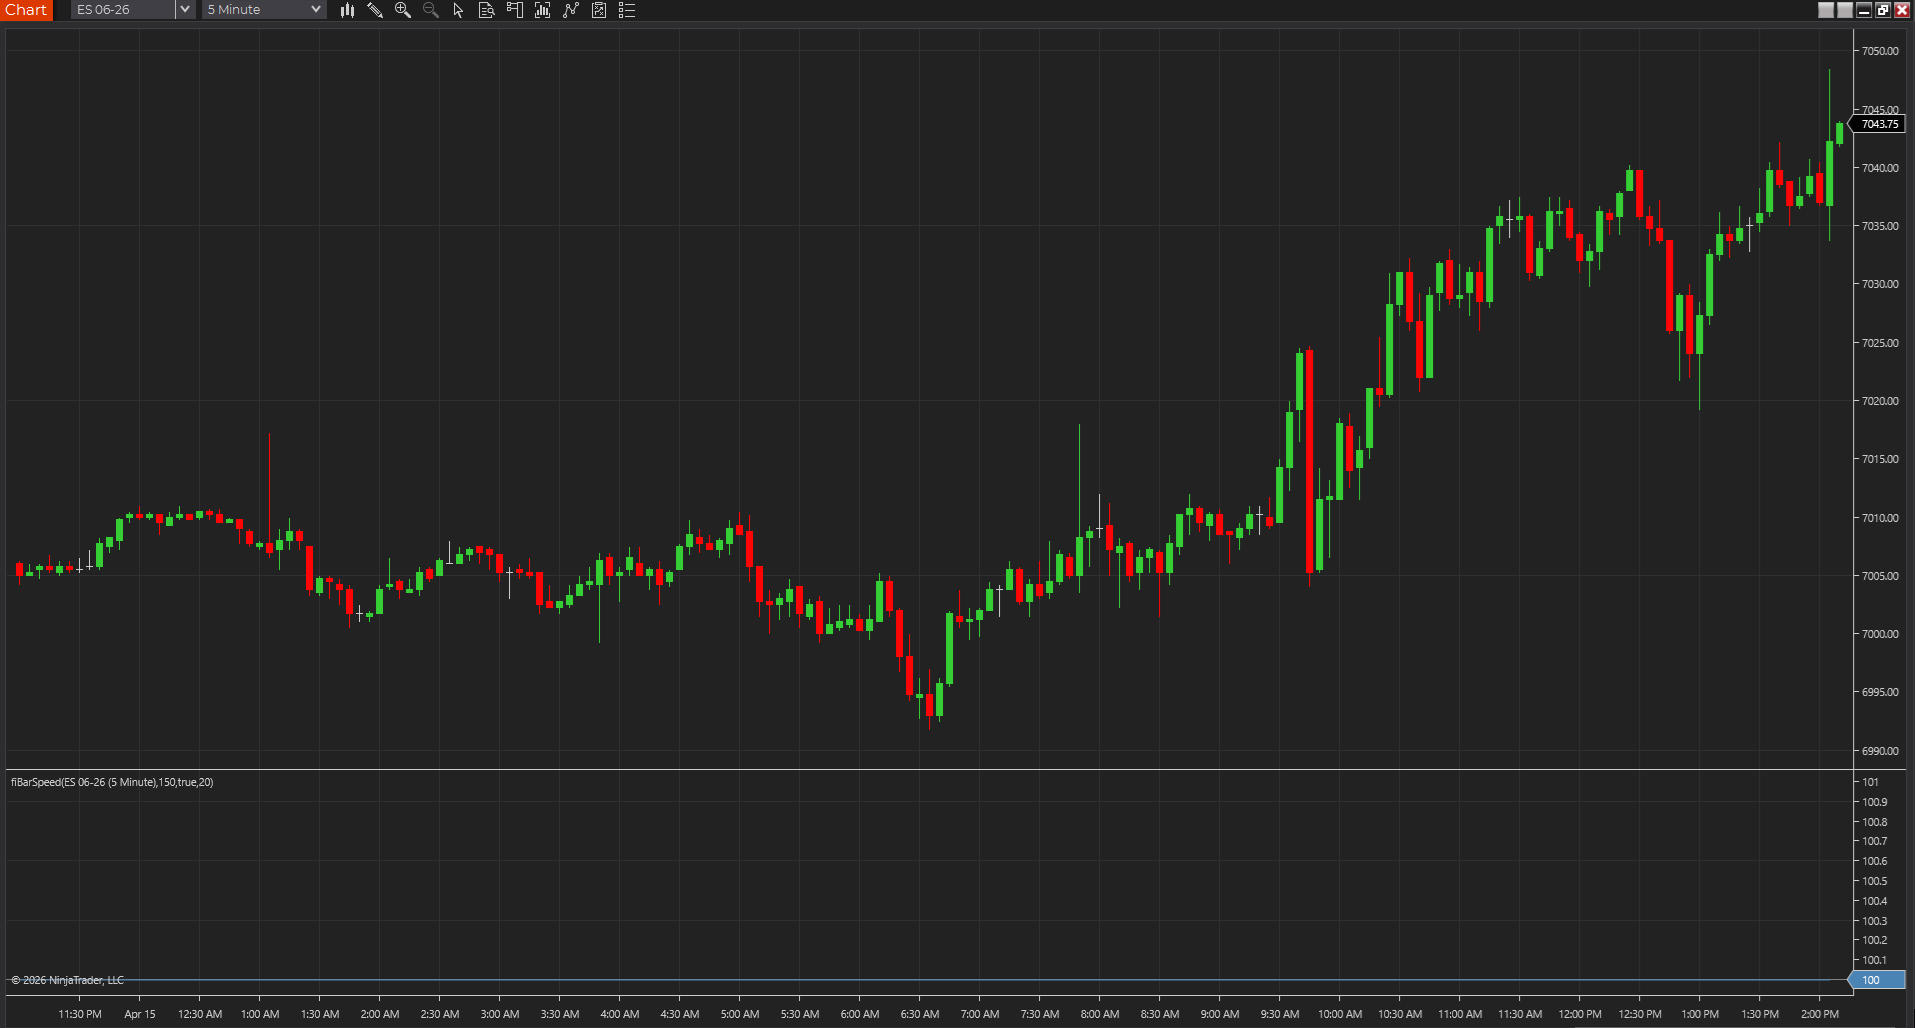
Shows whether bars are printing with real urgency or just drifting, so participation shifts stand out faster across tick, range, Renko, volume, and time charts.
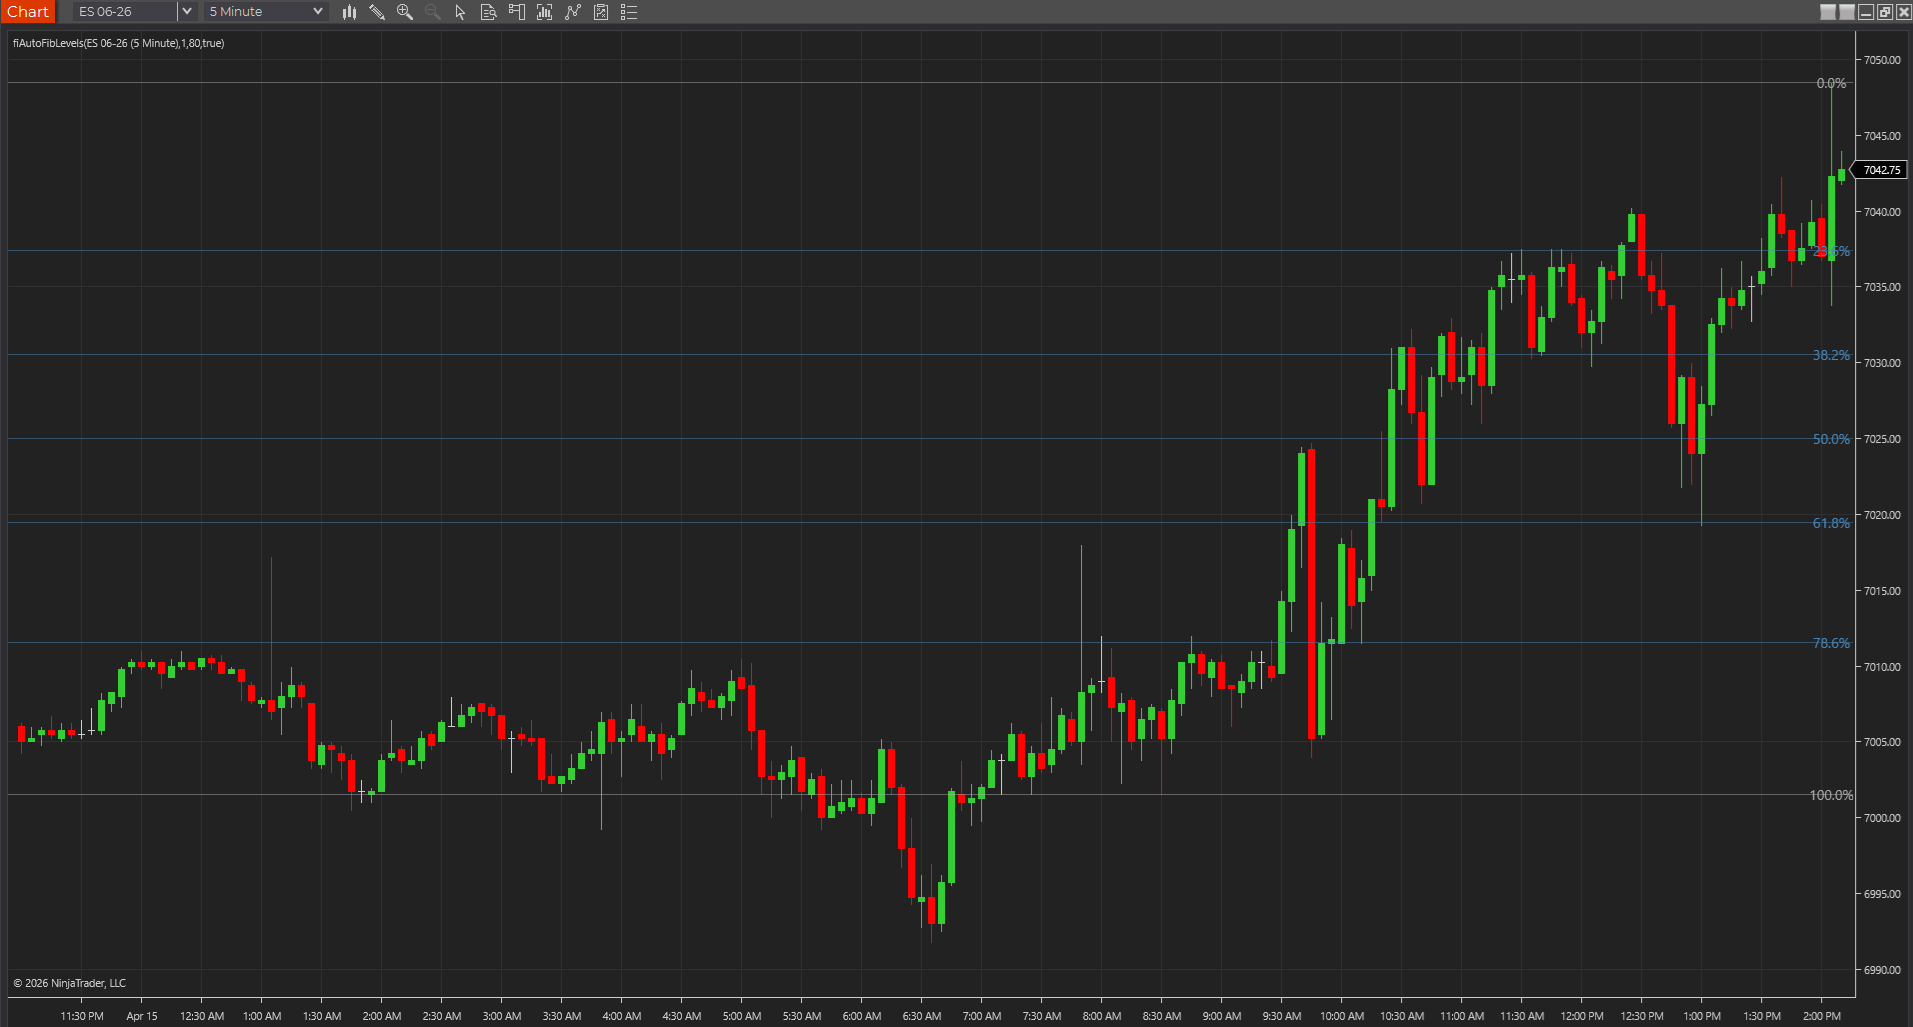
Keeps the recent swing's main Fibonacci retracement levels on screen, so pullback zones stay visible without manual drawing.
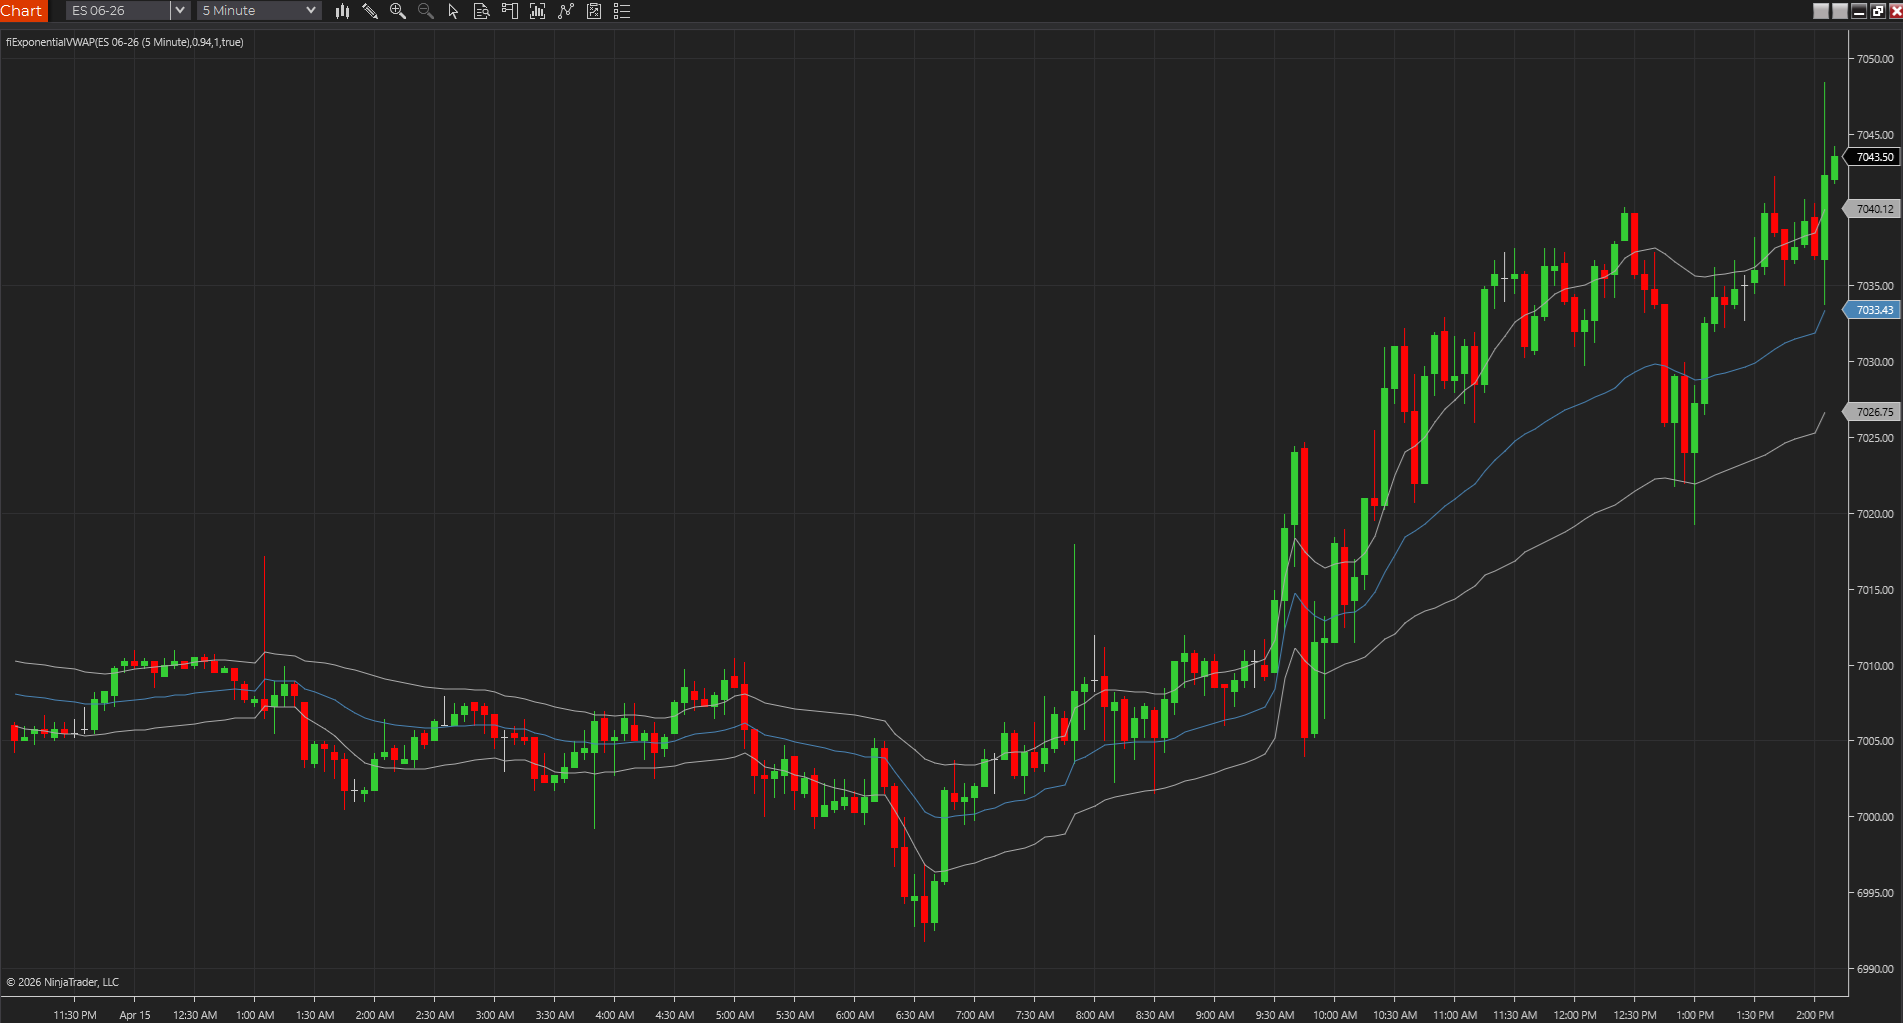
Uses exponential weighting to create a faster volume-weighted reference than standard session VWAP, which can help fair value react sooner during intraday shifts.
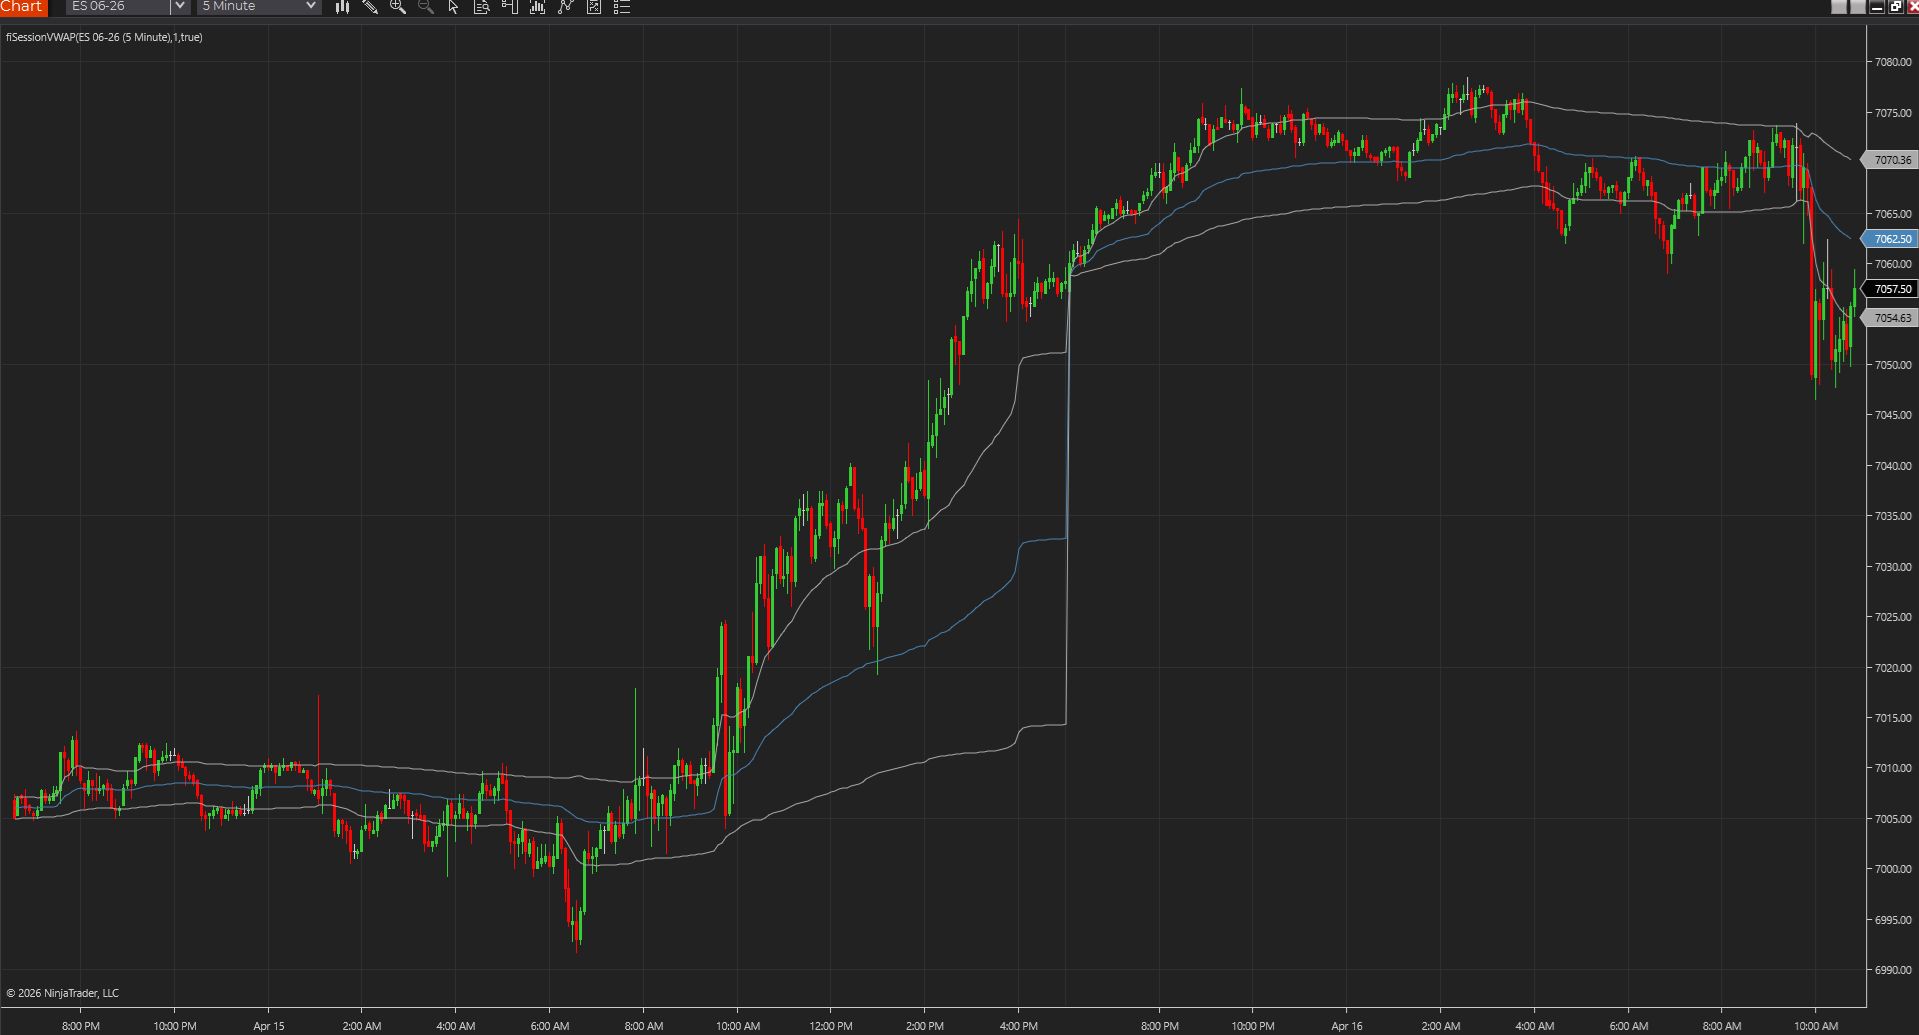
Plots a clean session-reset VWAP so traders can keep intraday fair value on screen without relying on a faster weighted variant.
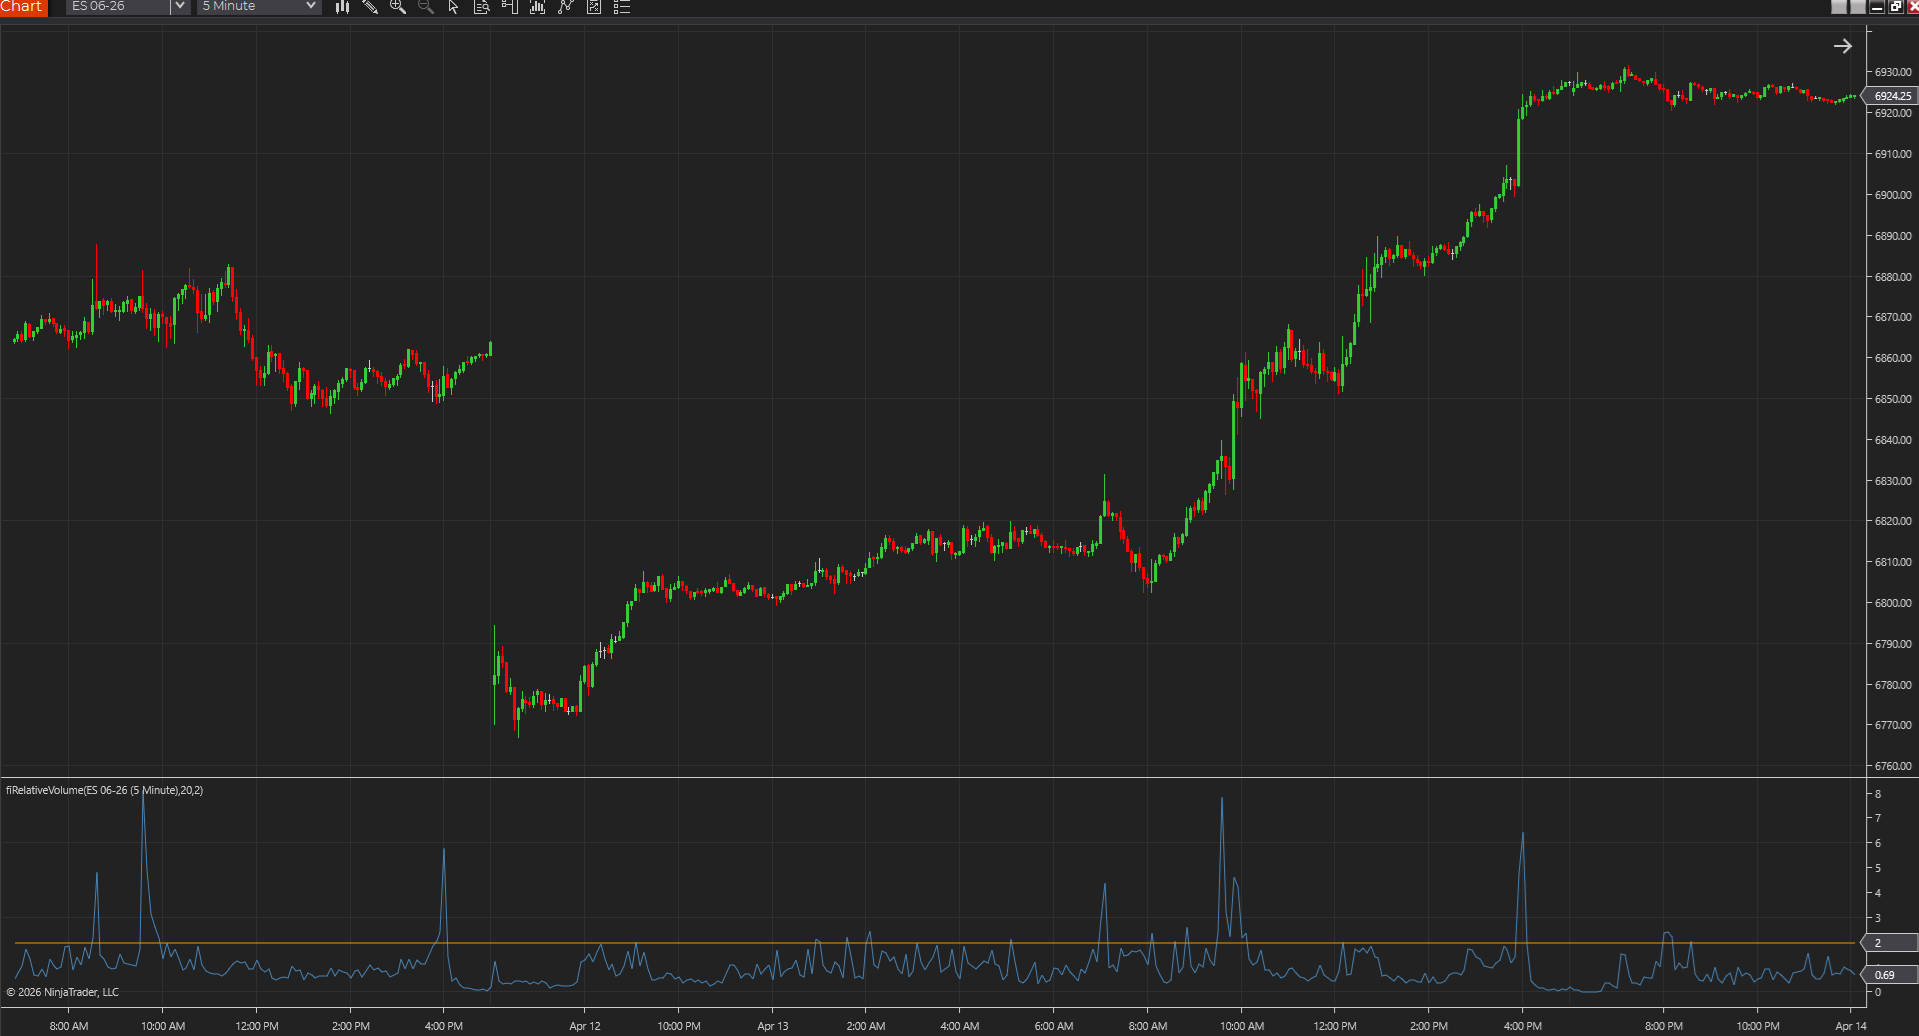
Measures current volume against its recent average so traders can see when participation is ordinary, elevated, or genuinely unusual.
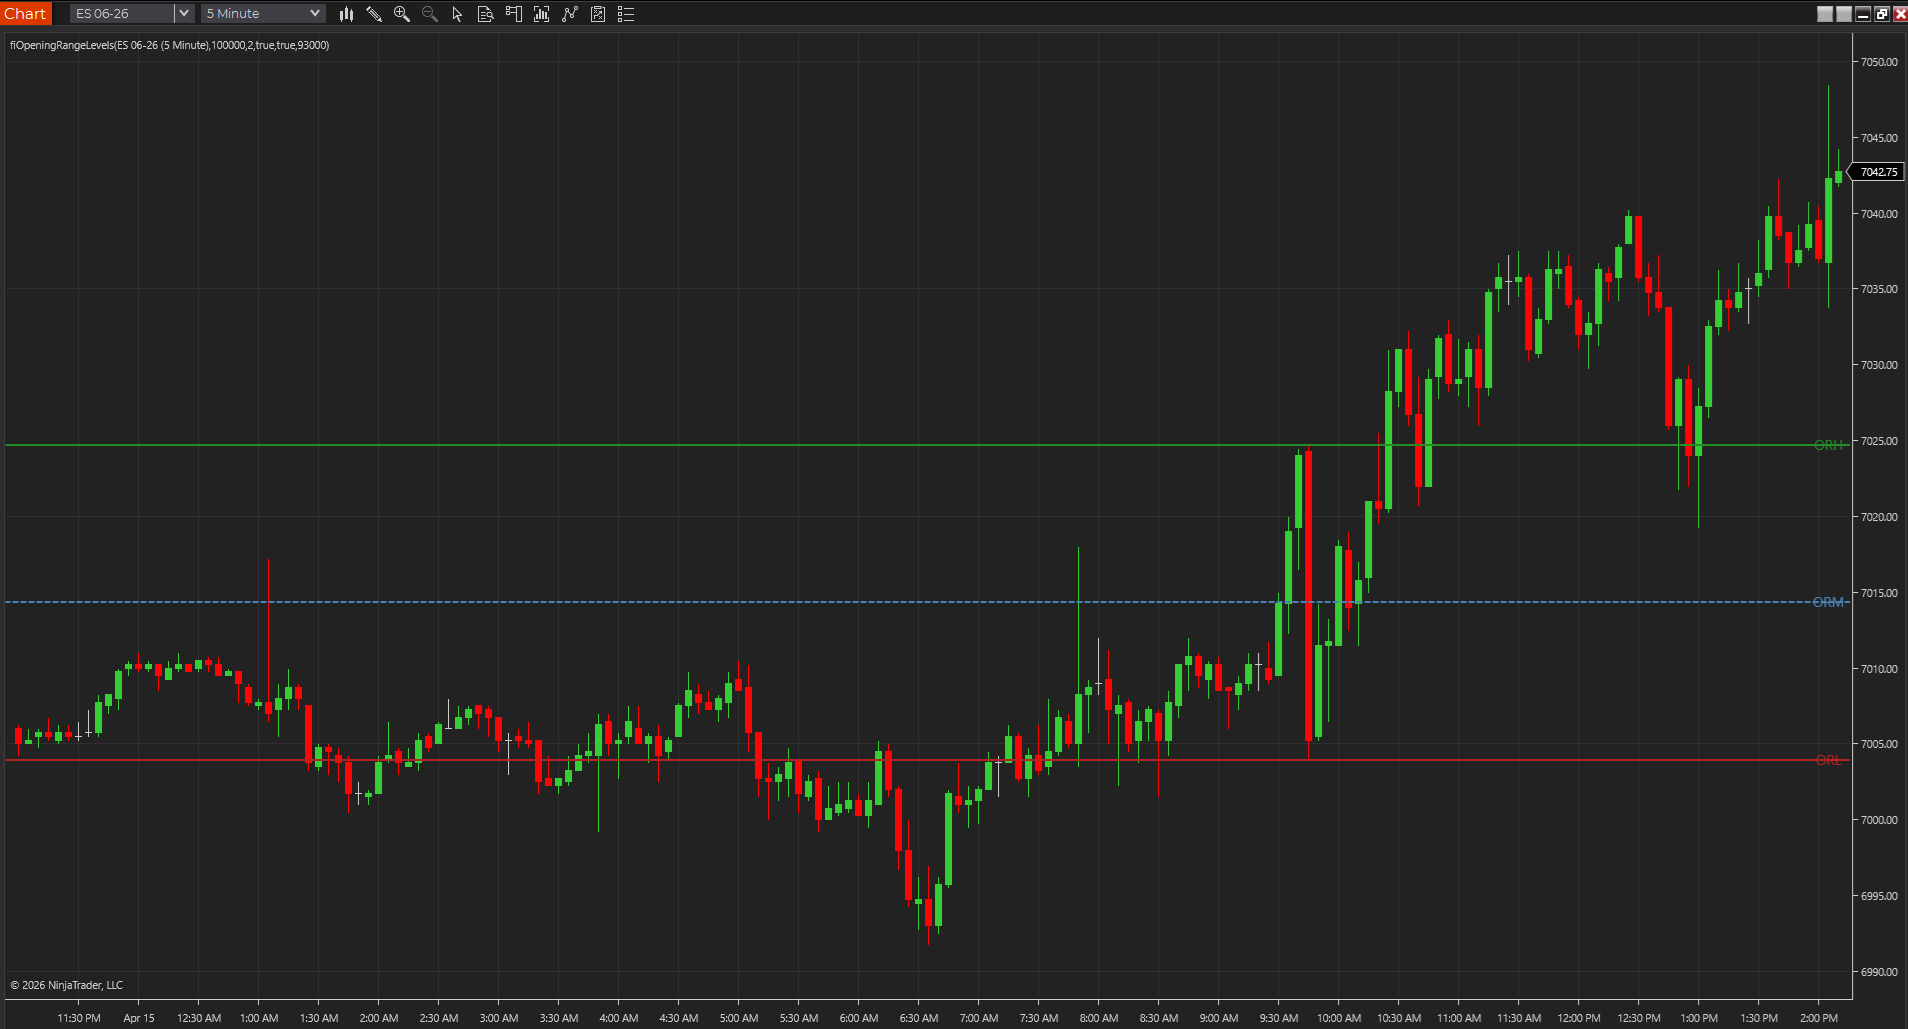
Marks the opening range high, low, and midpoint so the first-session balance area stays visible while the day develops.
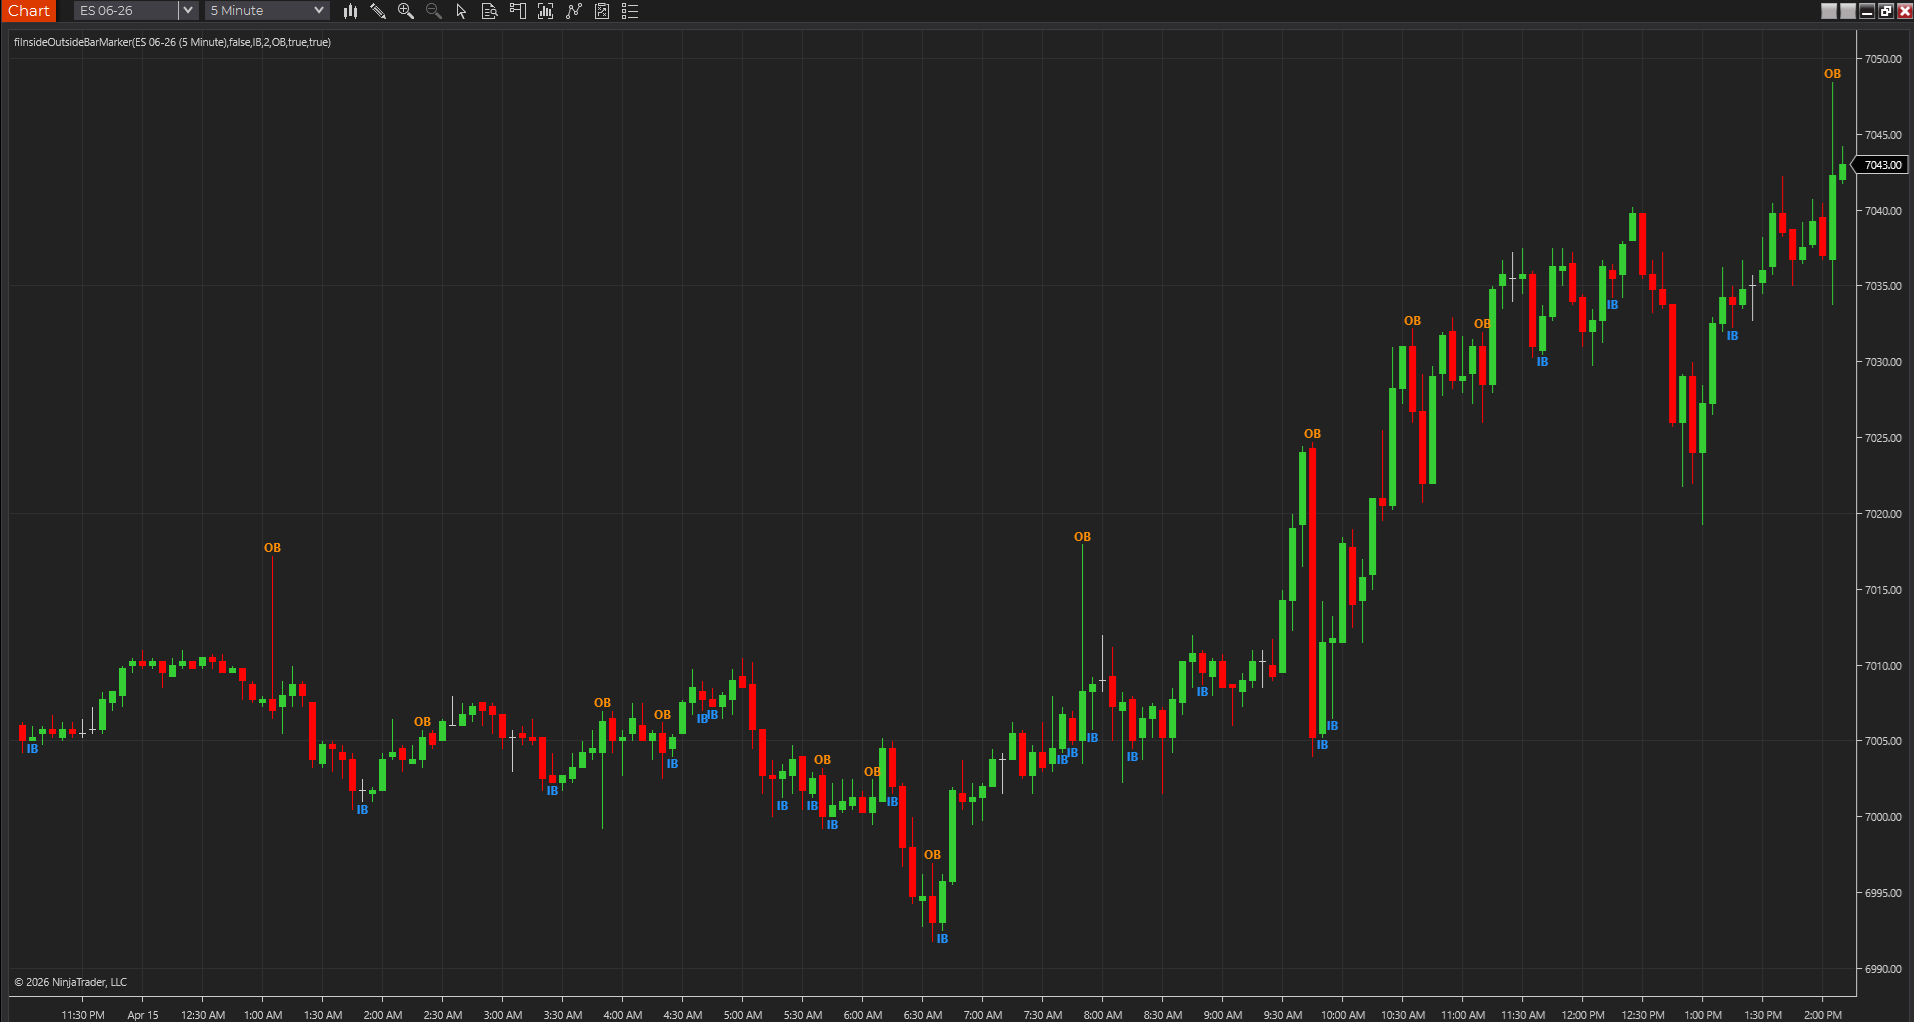
Flags inside bars and outside bars so common compression and expansion candles stand out immediately on the chart.
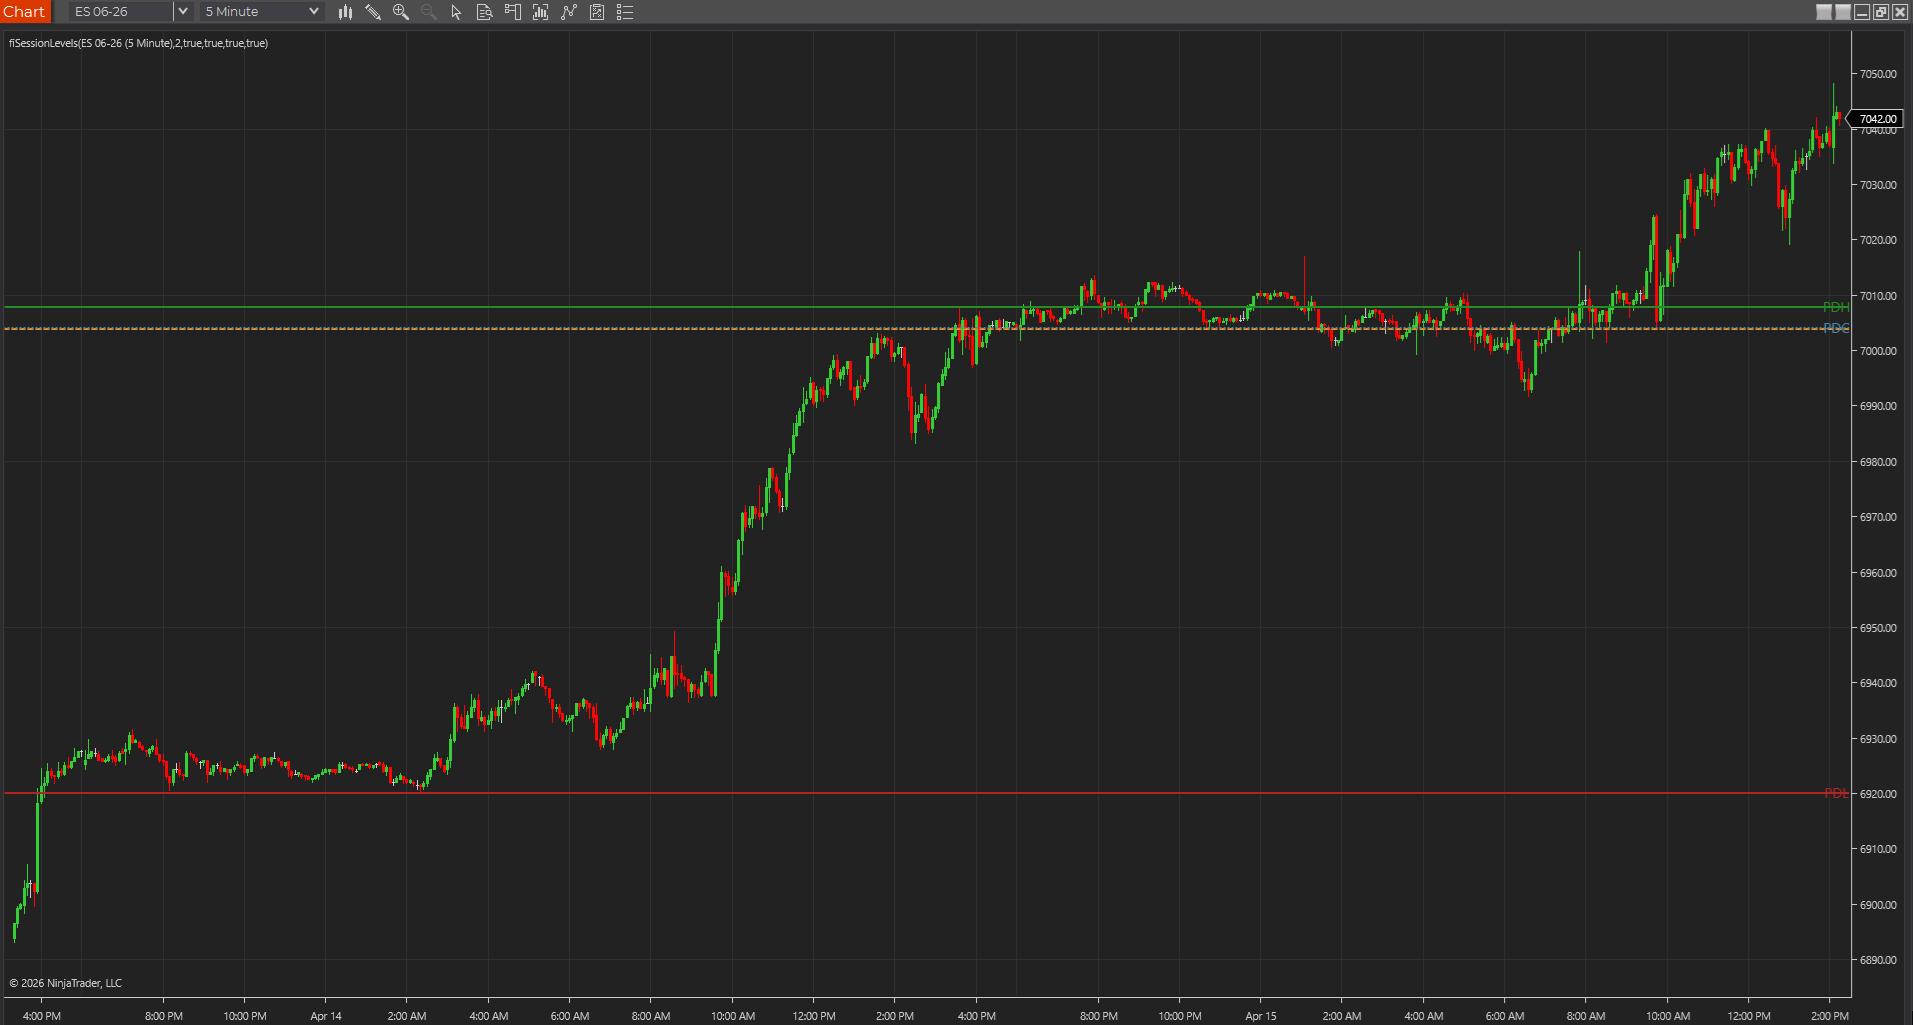
Keeps the prior session high, low, close, and current session open on screen so key session references stay visible all day.
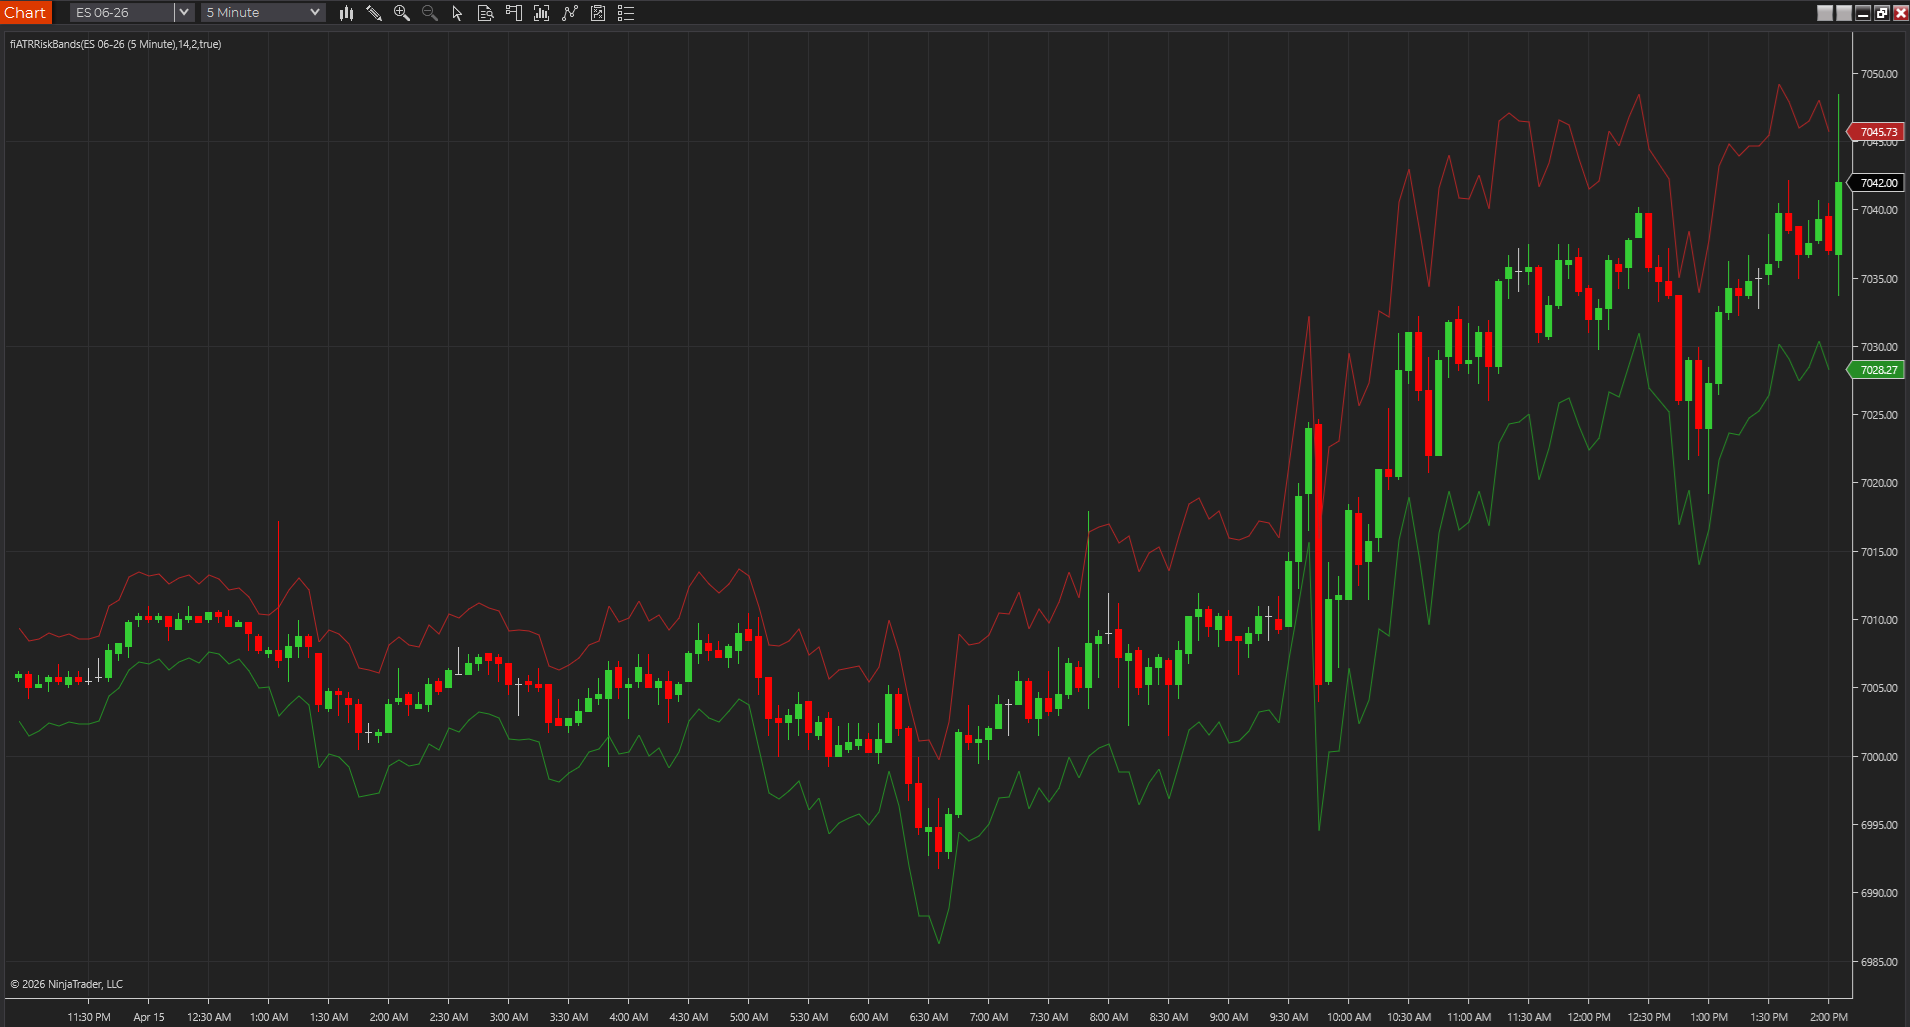
Plots ATR-based upper and lower bands around price so volatility-adjusted range and risk context stay visible at a glance.
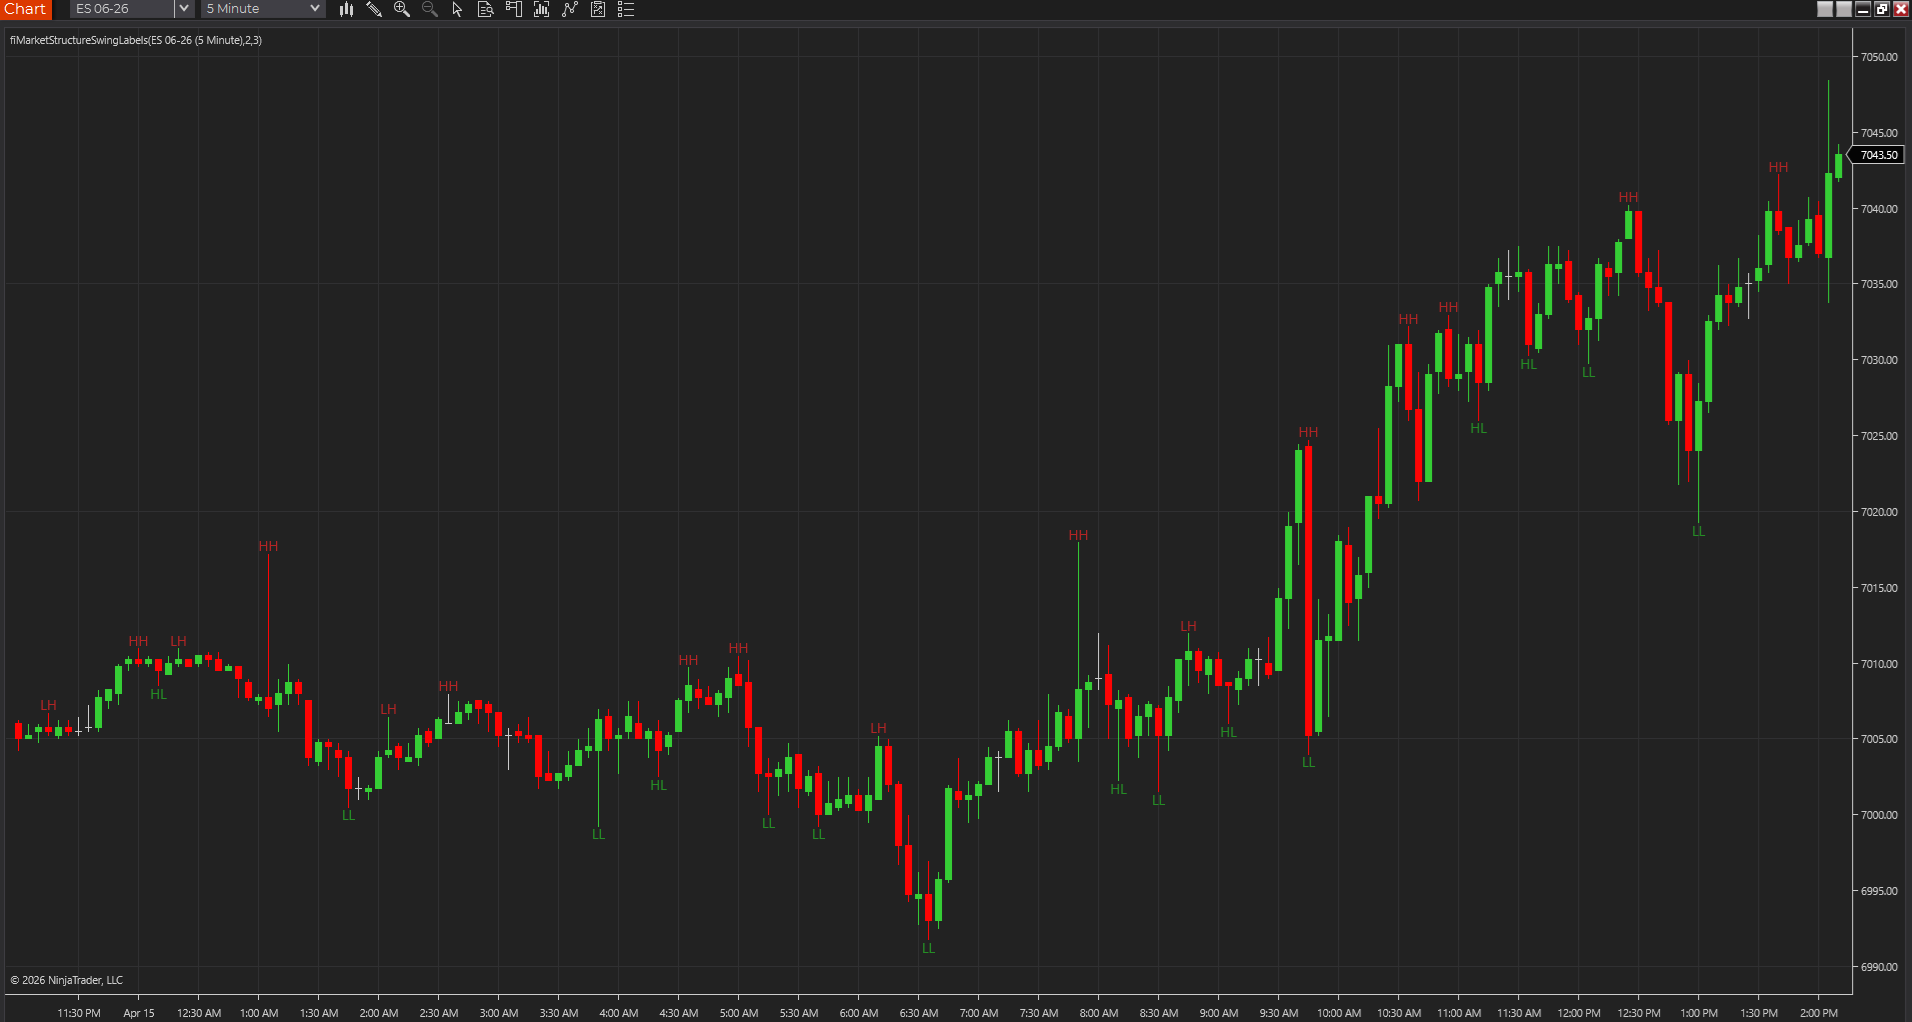
Labels higher highs, higher lows, lower highs, and lower lows so the current swing sequence is easier to read at a glance.
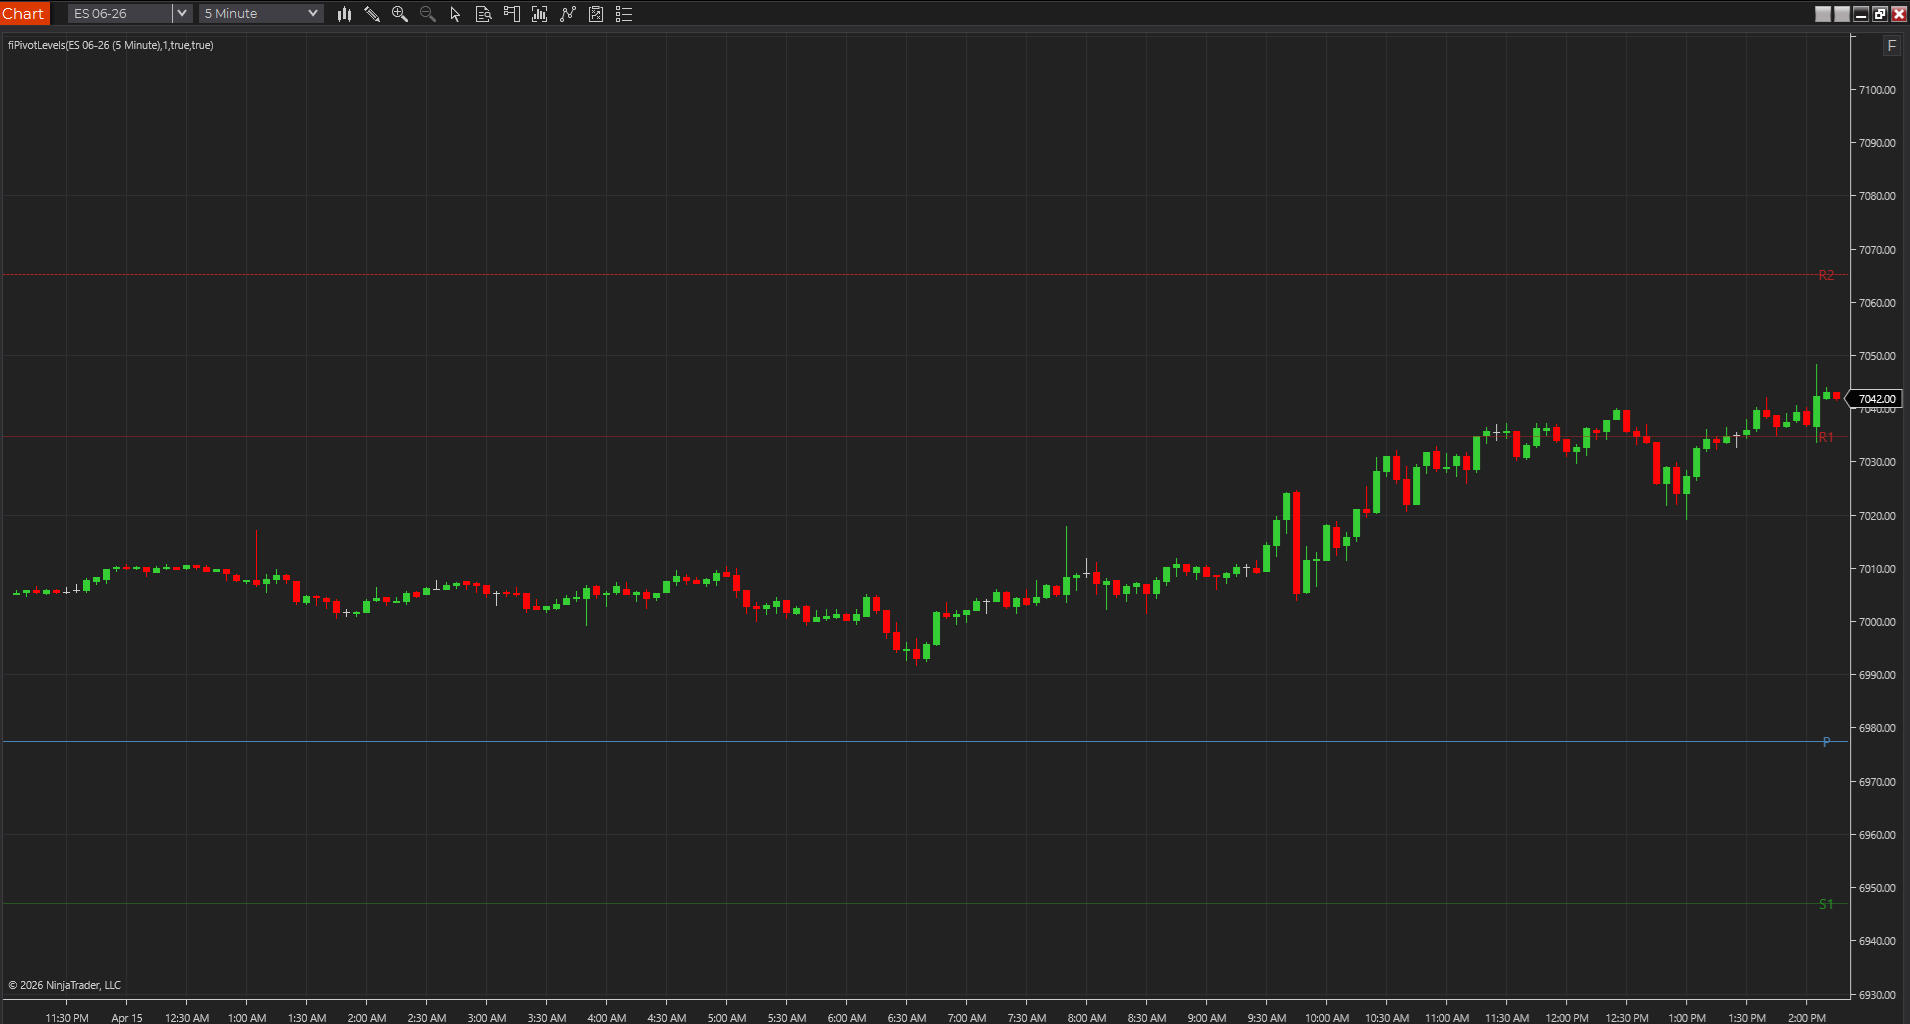
Draws classic pivot, support, and resistance levels from the prior session so traders have a ready-made intraday reference map.
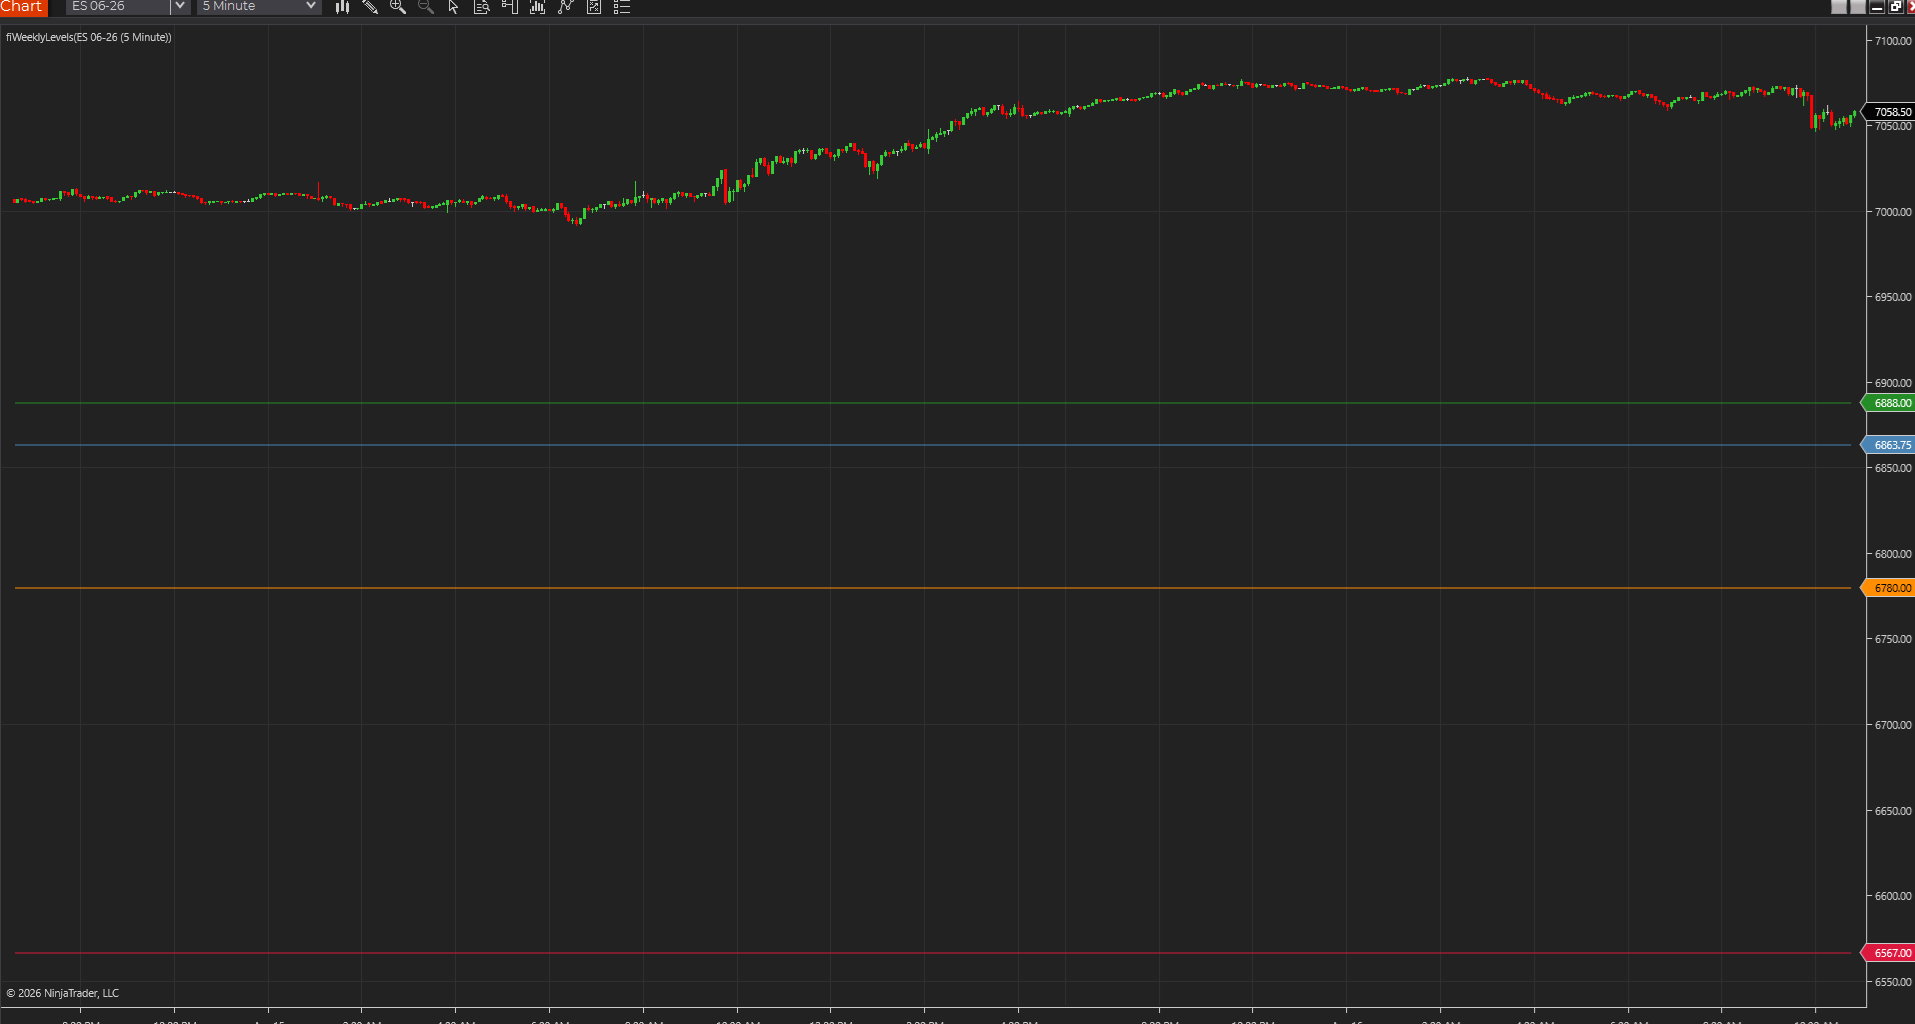
Keeps the prior week's high, low, close, and the current week's open on screen so broader reference prices stay visible on intraday charts.
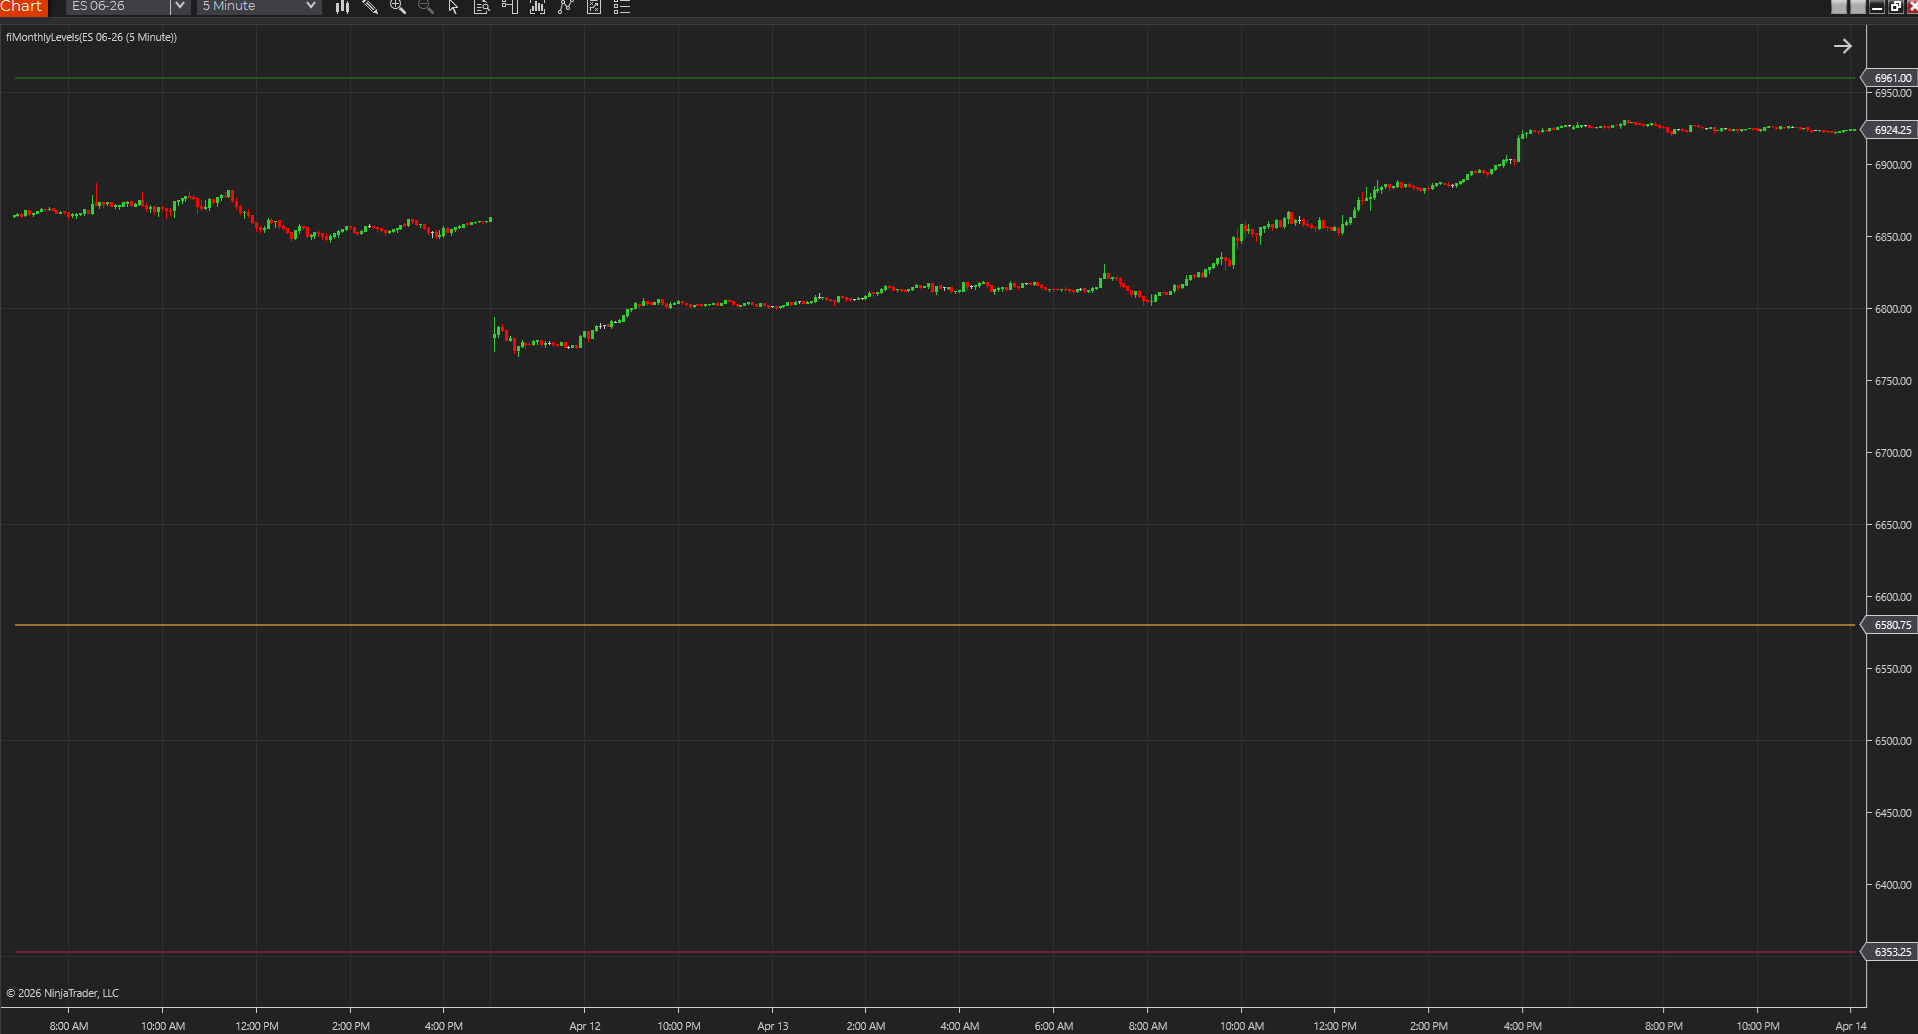
Shows the prior month's high, low, close, and the current month's open so bigger-picture reference prices stay visible every day.
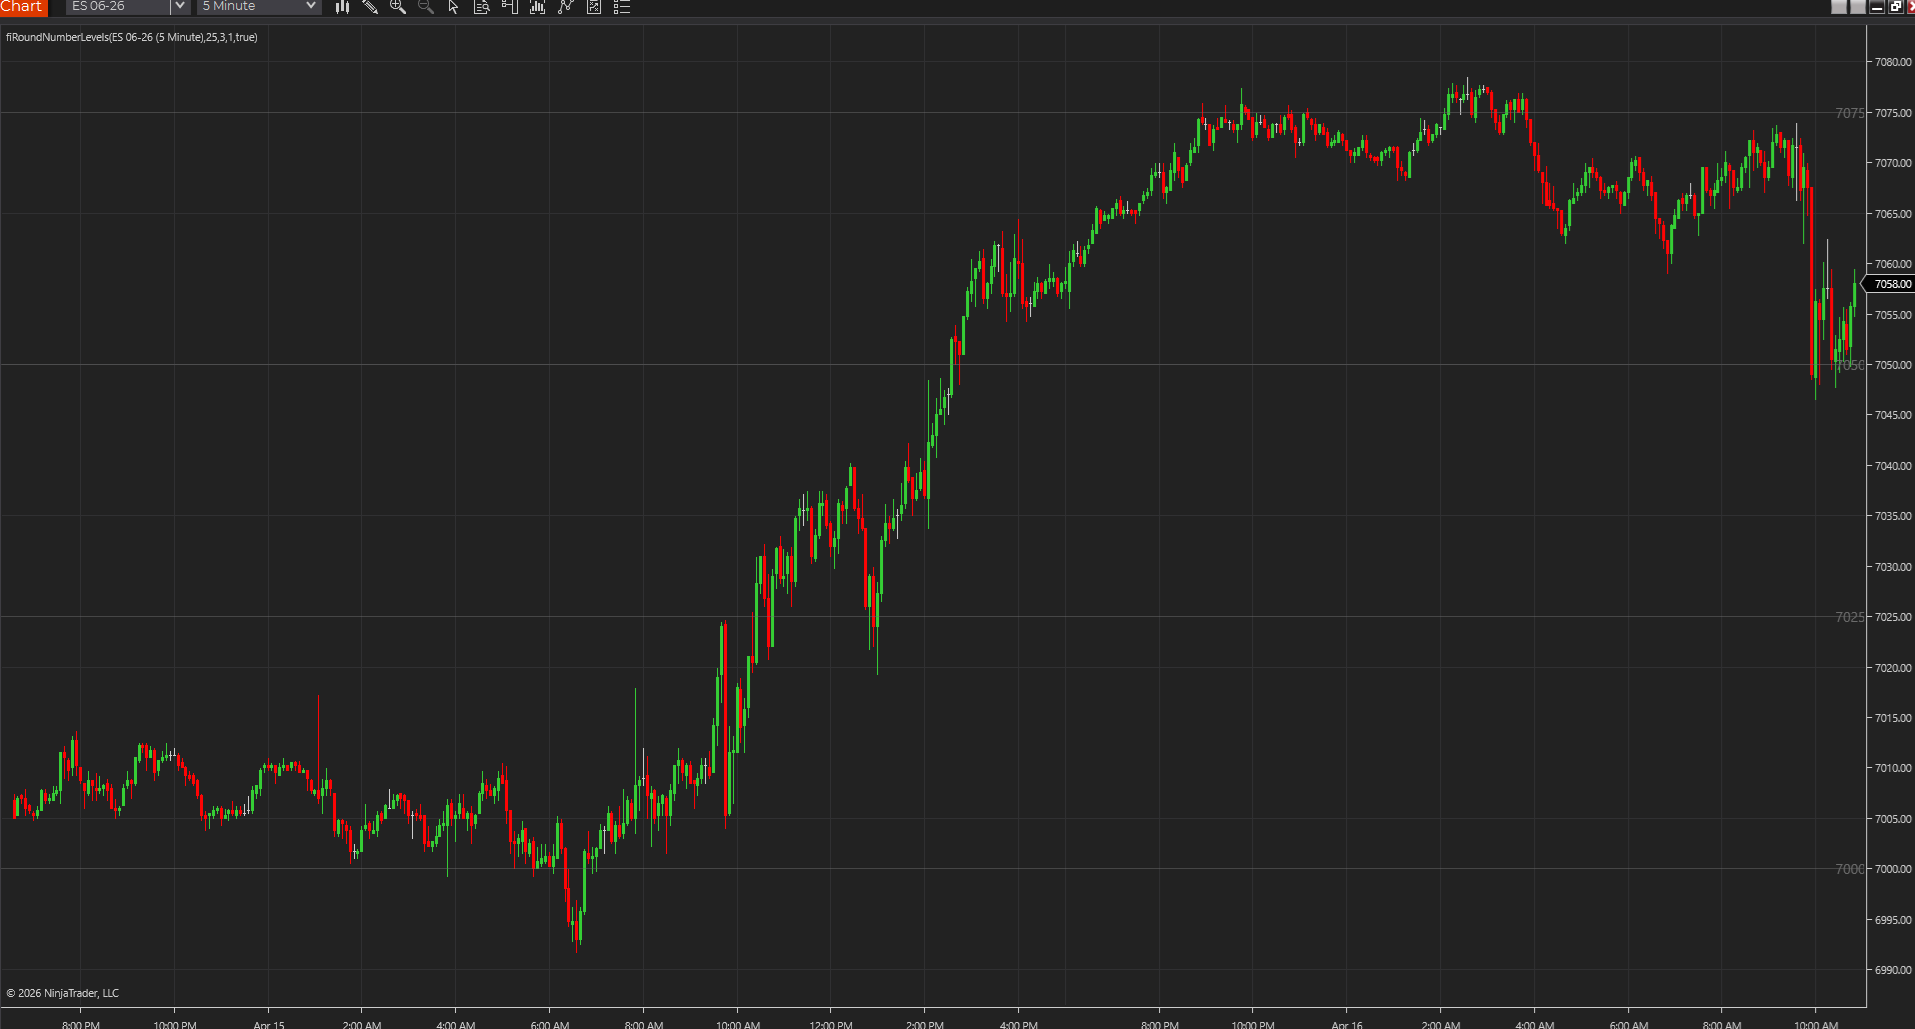
Draws round-number price references above and below the market so obvious psychological levels stay visible during fast intraday decisions.
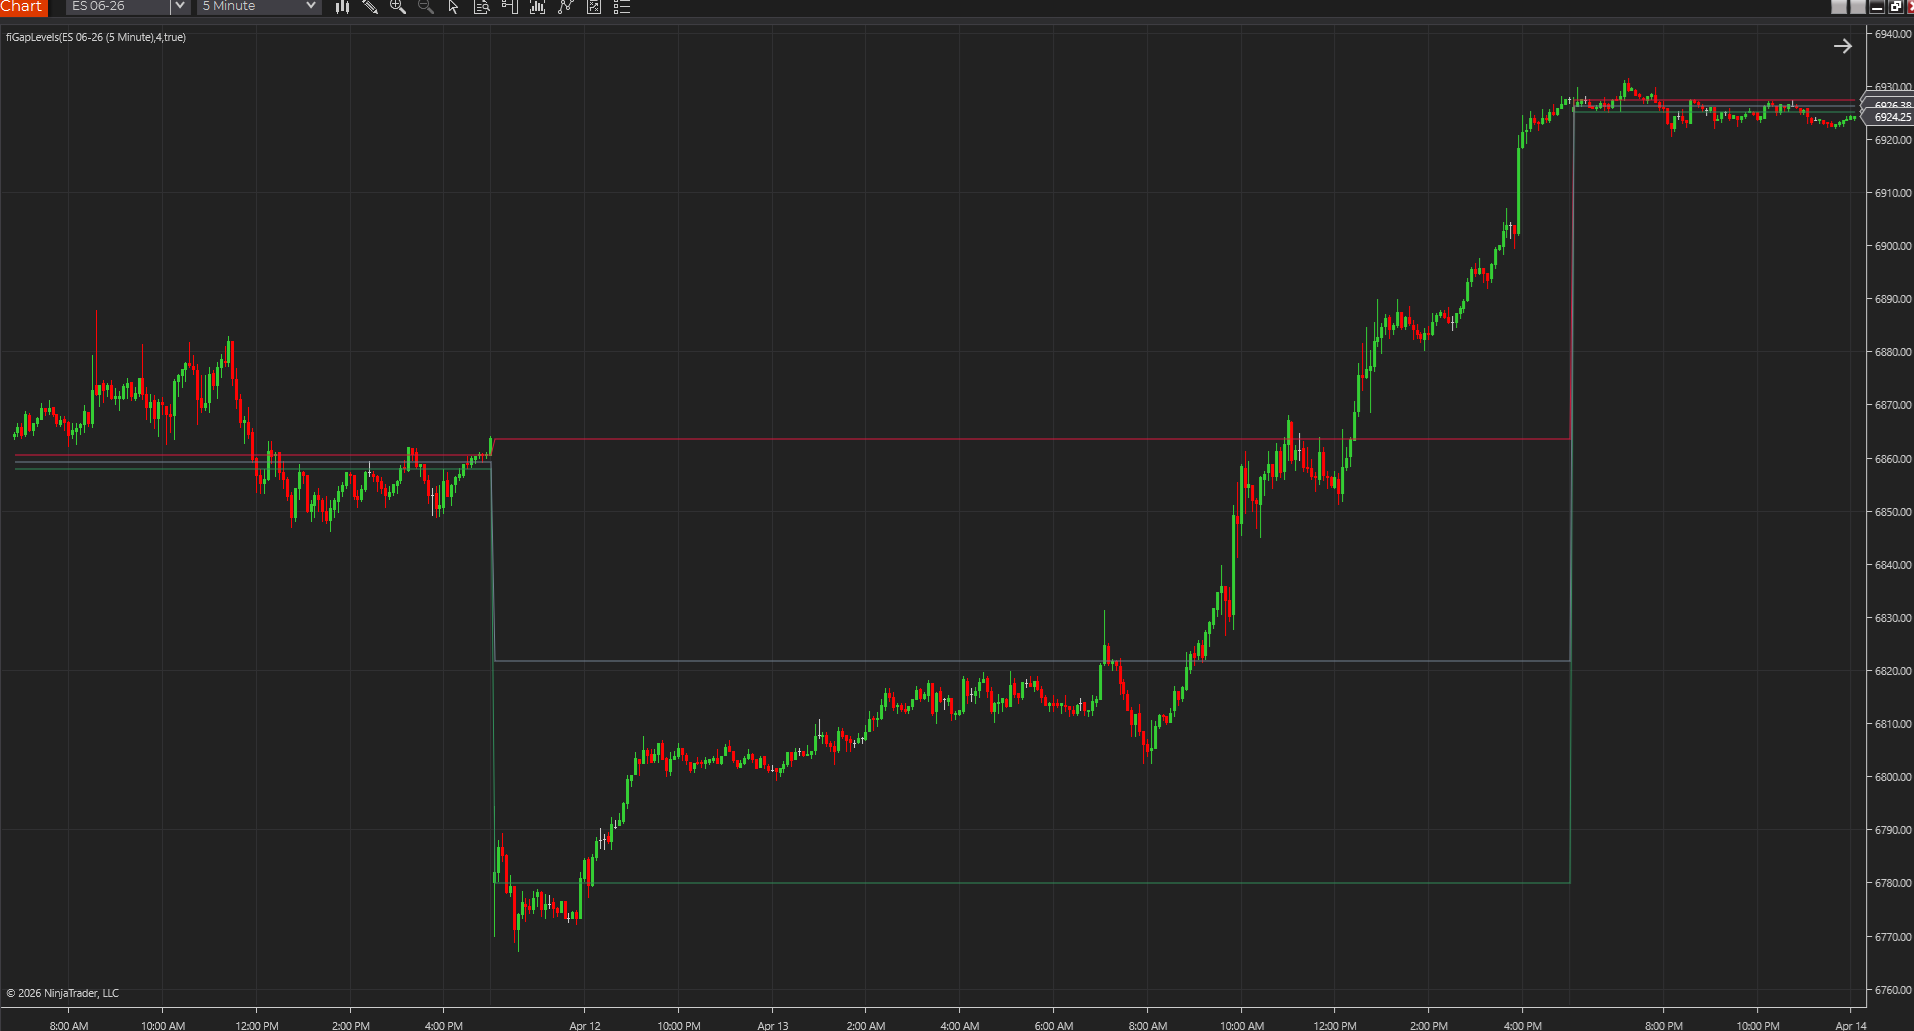
Marks opening gap boundaries and midpoint so traders can see the current session's gap structure without drawing it by hand.
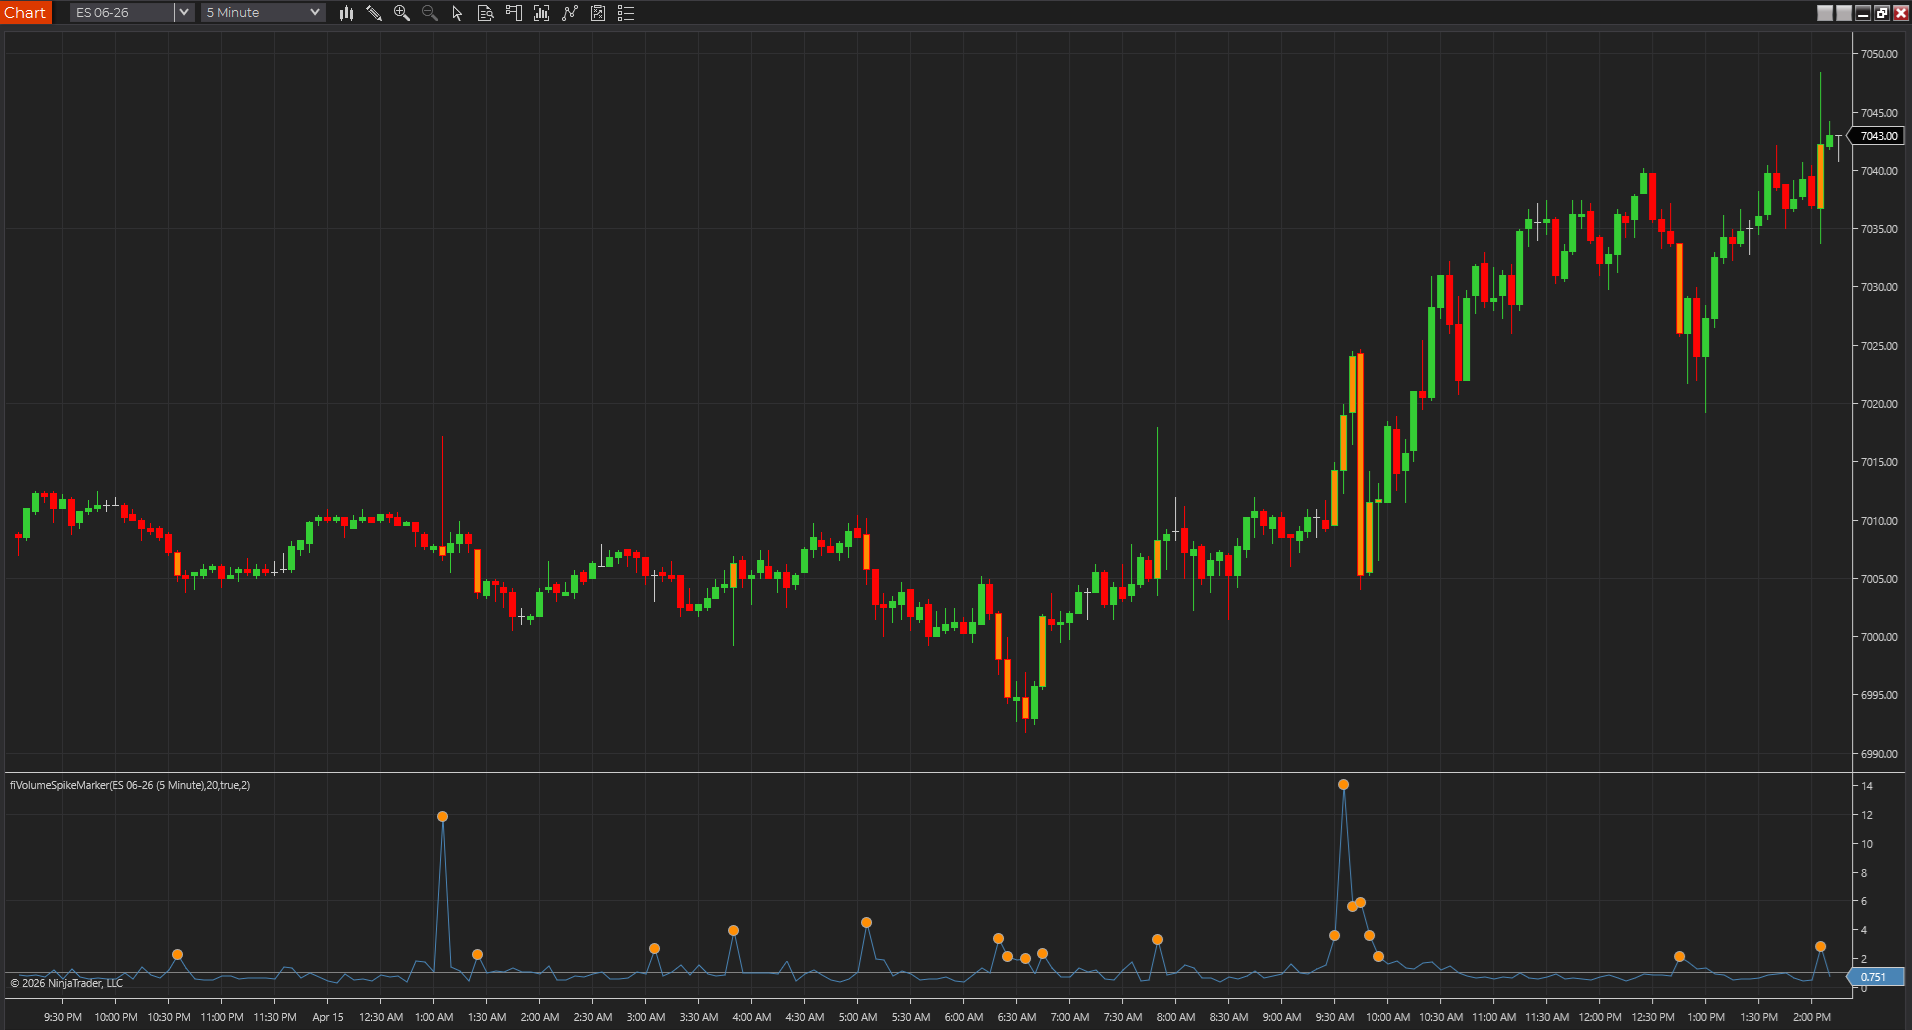
Compares current volume to recent average volume and highlights bars that are doing meaningfully more business than normal.
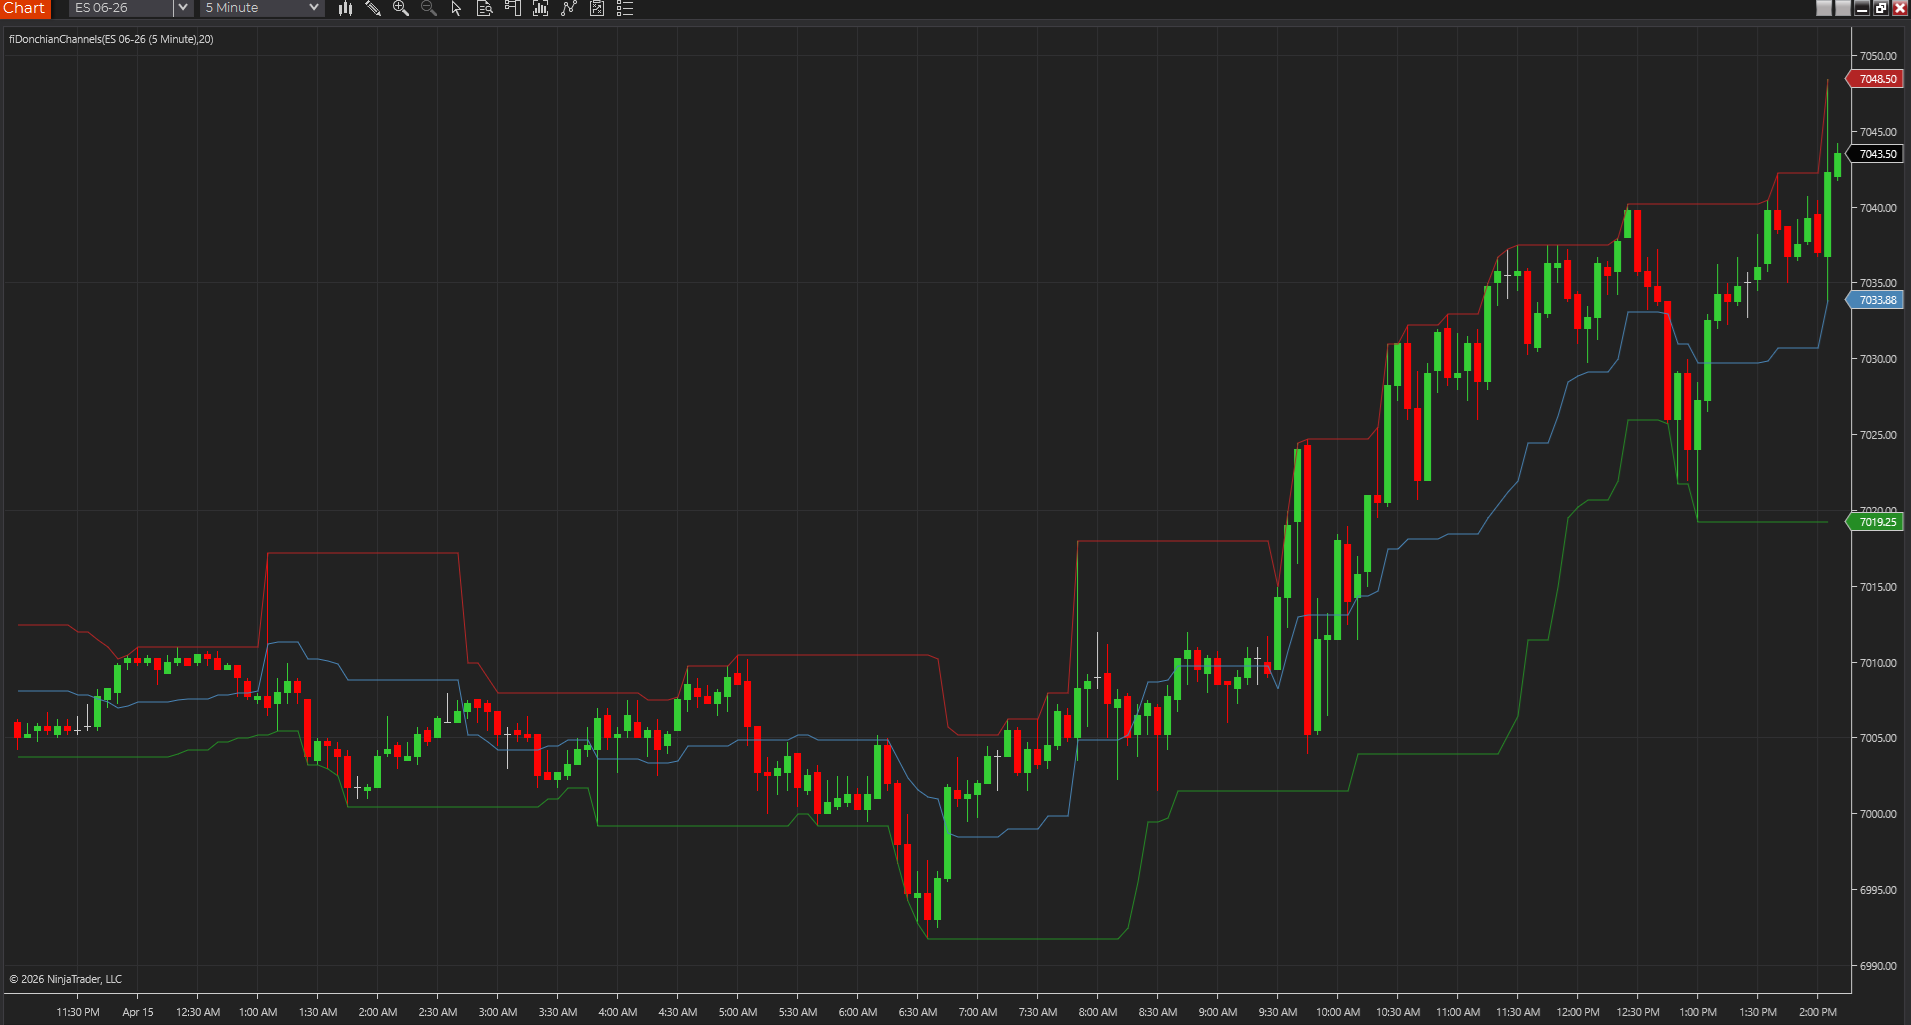
Plots the recent lookback high, low, and midpoint so breakout boundaries and range context stay obvious.
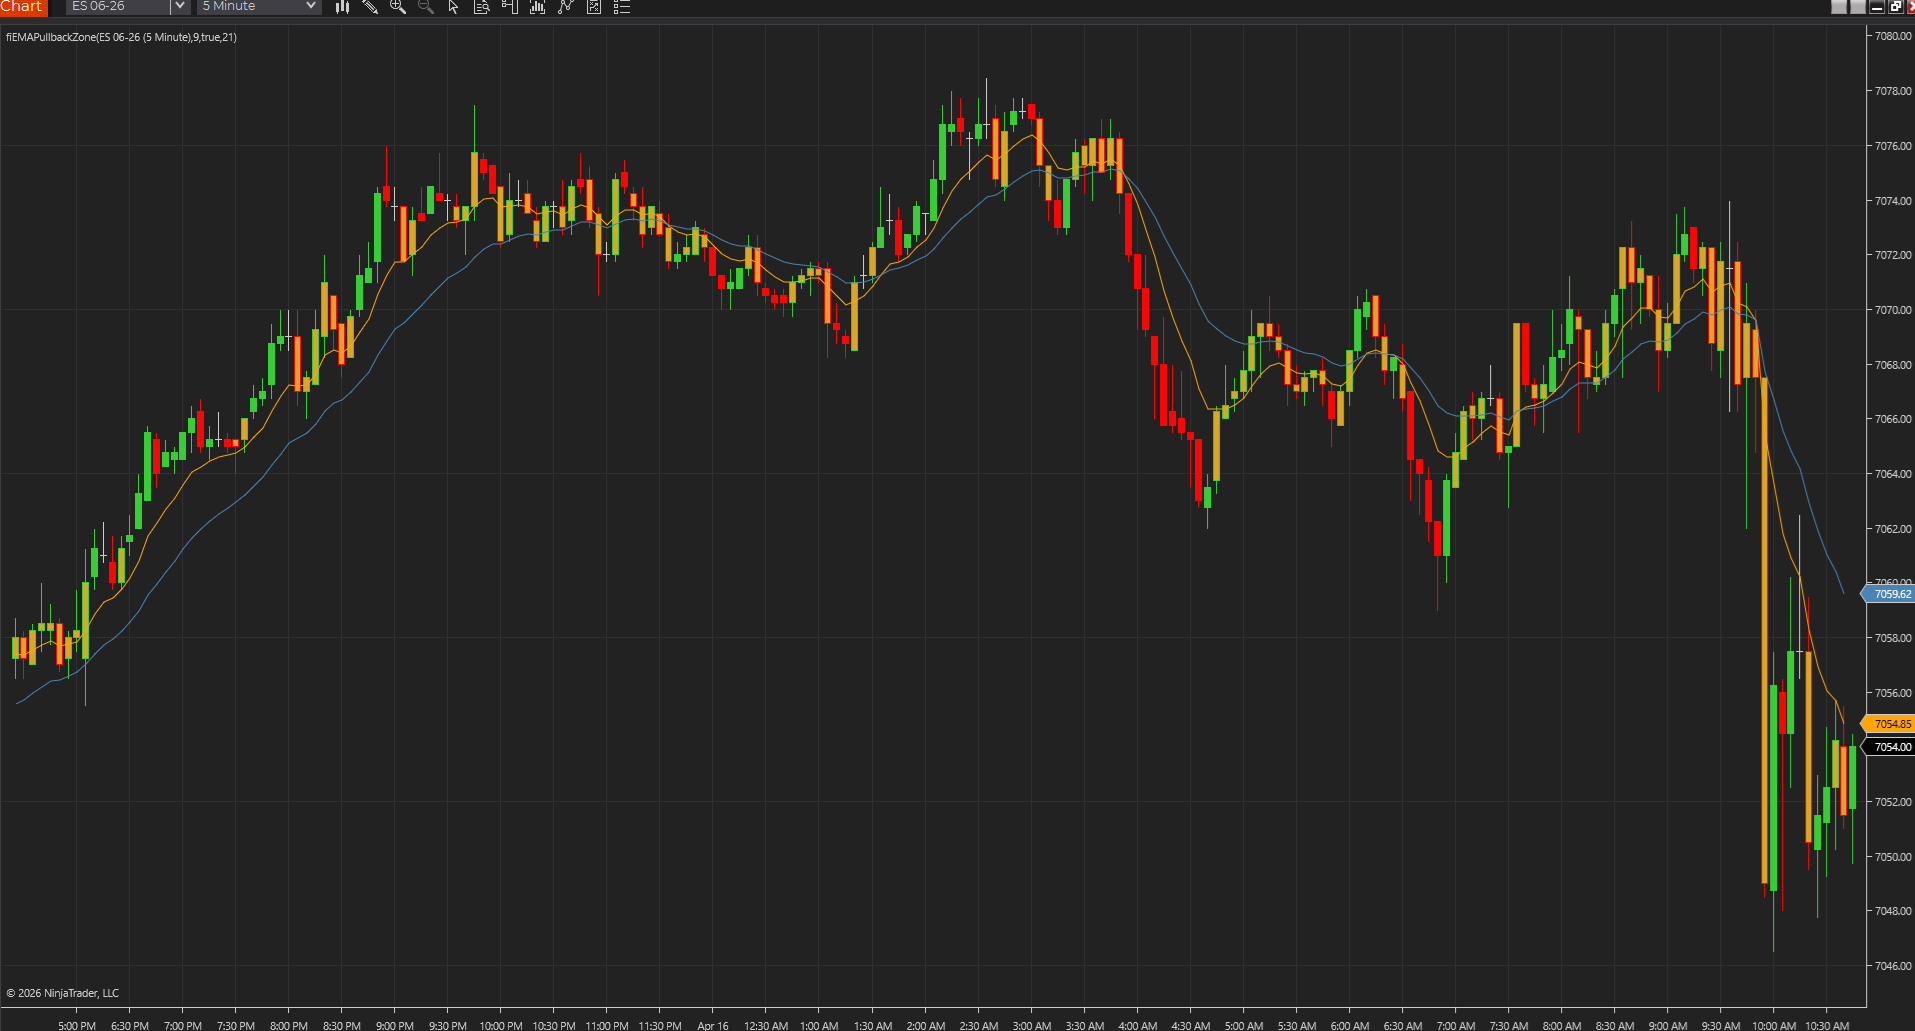
Plots a fast and slow EMA zone so traders can see where trend pullbacks are landing instead of guessing around a single average.
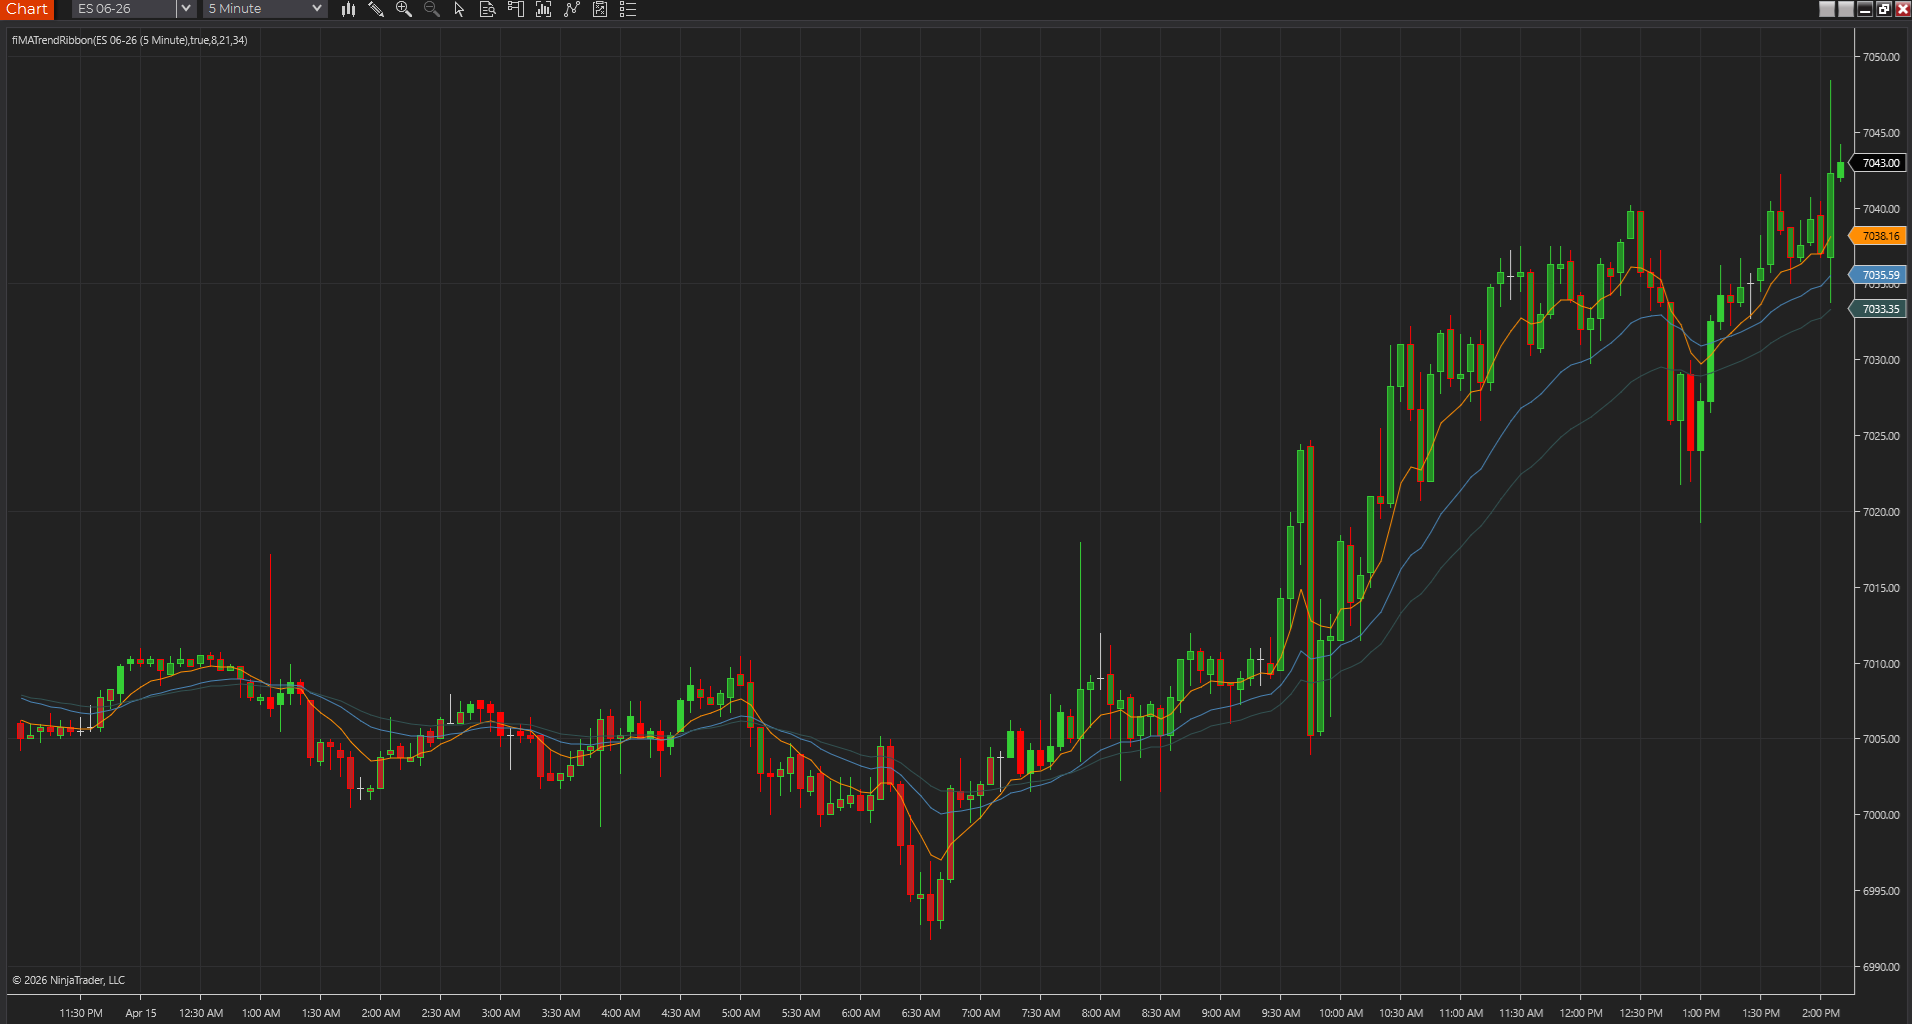
Plots fast, medium, and slow EMA lines so short-term trend alignment or compression is easier to read.
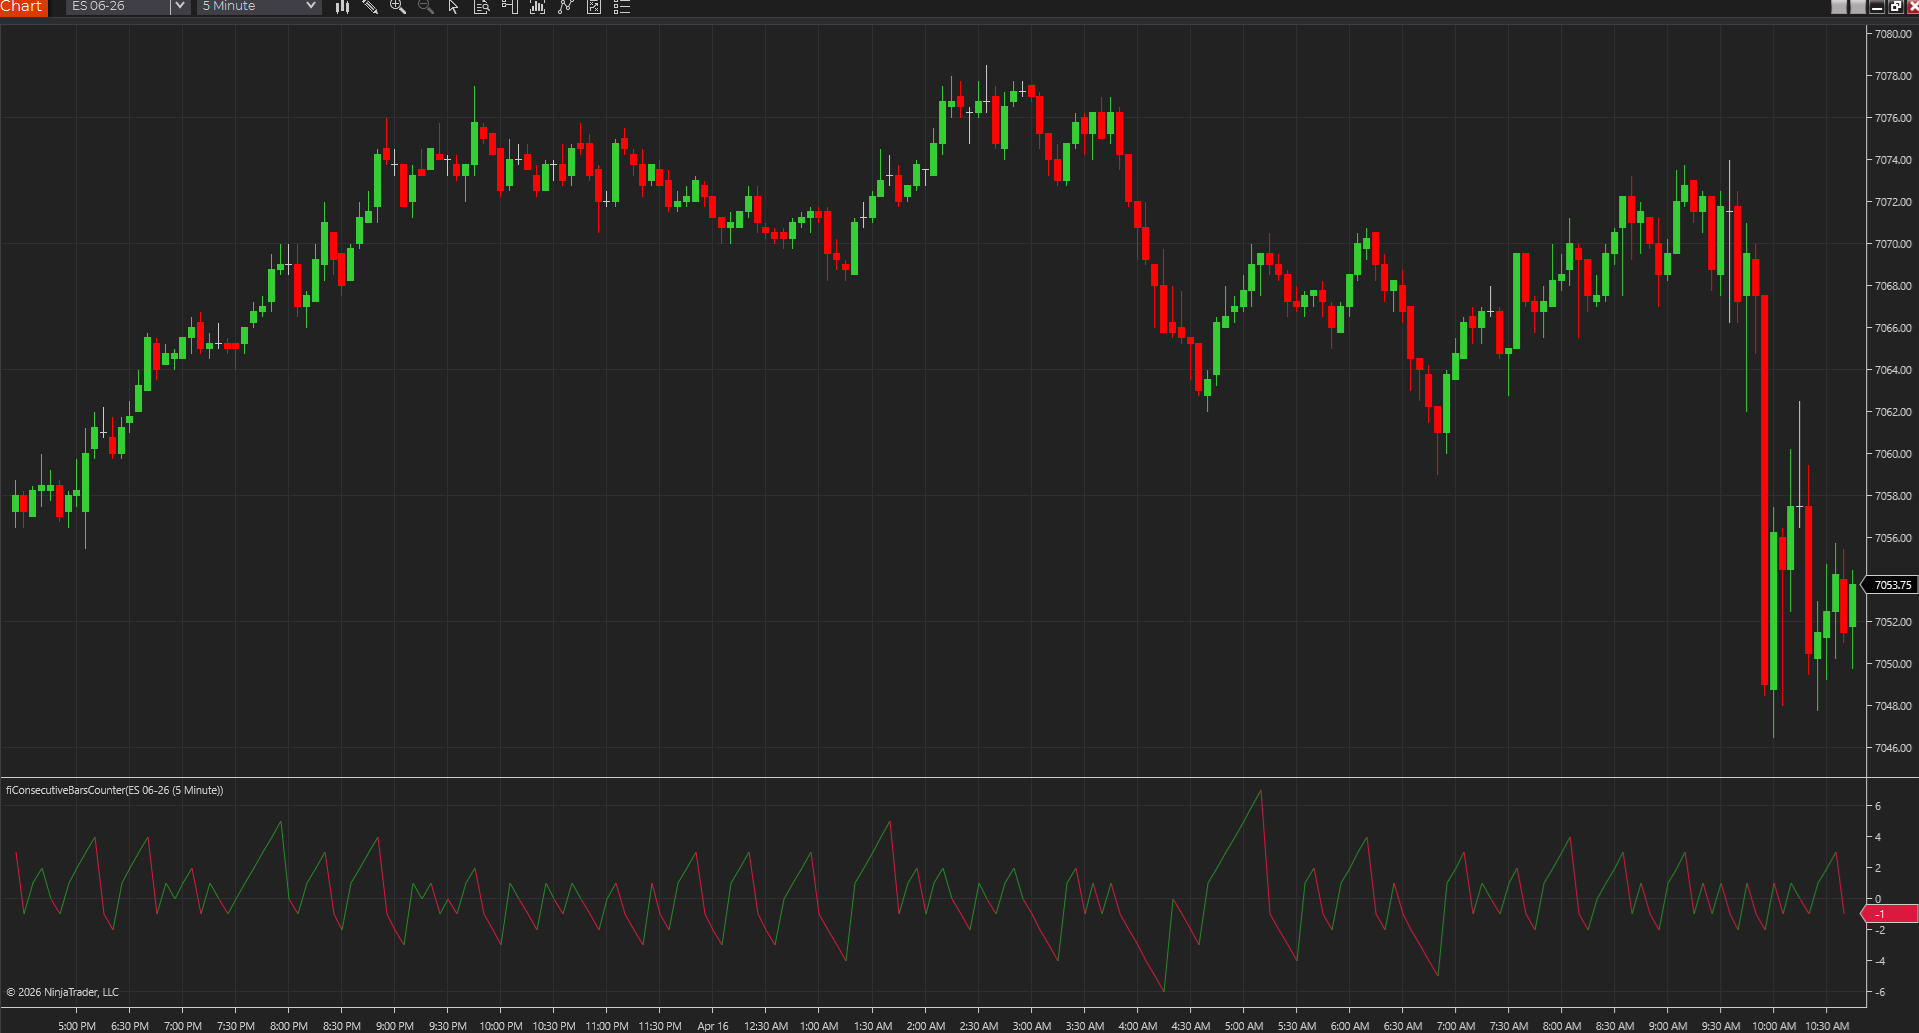
Counts consecutive higher-close and lower-close bars so traders can see short-term streaks instead of eyeballing every candle sequence.
No indicators match those filters yet.