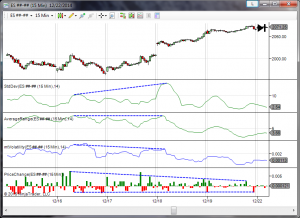
NinjaTrader Volatility Indicator Typically in technical analysis, traders will use the Standard Deviation as a measure of volatility. While this tends to be a fairly accurate, there are some flaws in the typical calculations which I have addressed in my NinjaTrader Volatility Indicator. The first step in calculating the Standard Deviation is to calculate the …
Tag: Forex Indicators
Browse through our extensive archive of completely free Forex Indicators Indicators below. Feel free to share them with your friends via the Social Media links provided below.
NinjaTrader Backtesting Software
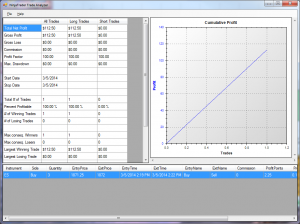
Programming an automated trading strategy can be a time consuming and/or costly venture. Unfortunately without investing the time and/or money in to having your strategy programmed, the only way to backtest the strategy and get an idea how it performs historically is to log each trade by hand. Backtesting Strategies by hand can be a …
Divergence Indicator For NinjaTrader
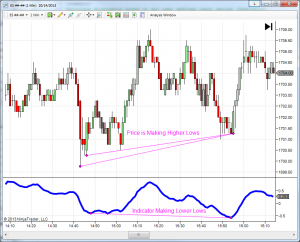
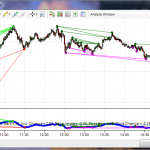
A very common request I receive for custom indicators and strategies is to include divergence. While divergence is easy for the eyes to see, it can be quite difficult to define in terms that are programmable. The Divergence Indicator for NinjaTrader utilizes a sophisticated algorithm to detect divergence, and eliminates some shortcomings of typical divergence …
Swing Trading Secrets
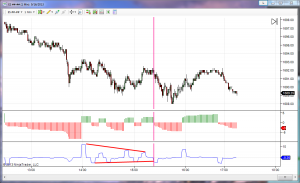
Swing Trading Secrets- Identifying Divergence and Convergence in Swings In my experience as a trader, I have found swing trading to be one of the easier methods of making consistent income. However, there are certainly Swing Trading Secrets you don’t know. While swing trading does not offer the unbelievably high rate of return that day …
Opening Range Breakout
Opening Range Breakout – Larry Williams, Toby Crabel, and Sheldon Knight Methods The Opening Range Breakout is a very common trading strategy that has been around for many years. In over a decade of trading, it is one of the very few daytrading strategies that I have found to be fairly consistent. An article I …
Support And Resistance on Higher Time Frames
Support And Resistance Indicator for NinjaTrader Pivot points are commonly used by traders to identify key Support and Resistance levels in the markets. This indicator allows the user to display Pivot points from higher time frame charts (ex. Daily Charts), on lower time frame charts (ex. 15 minute charts). This allows you to see …
Automatic Fibonacci Retracement Indicator
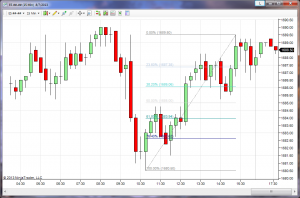
Fibonacci Retracement Indicator A Fibonacci Retracement indicator is often used by traders as an indication of support and resistance. These indicators provide Fibonacci levels that are determined by identifying two extreme points (ex. a swing high and a swing low), and dividing the vertical distance by Fibonacci ratios. Fibonacci Retracement indicators can be used in …
Moving Average Crossover Traders – How to Beat Them
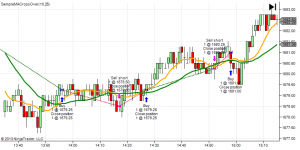
Moving Average Crossovers For many years, futures, fores, and equities traders alike have been using moving average crossovers to determine trends in the market. A very common trading strategy amongst traders is to go long when a faster moving average crosses above a slower moving average, and to go short when the faster moving average …
- 1
- 2

