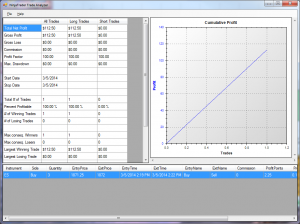
Programming an automated trading strategy can be a time consuming and/or costly venture. Unfortunately without investing the time and/or money in to having your strategy programmed, the only way to backtest the strategy and get an idea how it performs historically is to log each trade by hand. Backtesting Strategies by hand can be a …
Tag: futures
Divergence Indicator For NinjaTrader
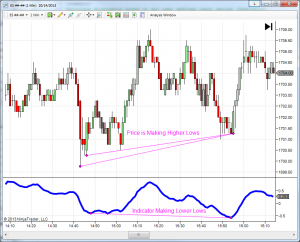
A very common request I receive for custom indicators and strategies is to include divergence. While divergence is easy for the eyes to see, it can be quite difficult to define in terms that are programmable. The Divergence Indicator for NinjaTrader utilizes a sophisticated algorithm to detect divergence, and eliminates some shortcomings of typical divergence …
Automatic Fibonacci Retracement Indicator
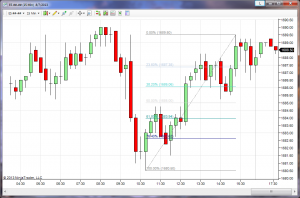
Fibonacci Retracement Indicator A Fibonacci Retracement indicator is often used by traders as an indication of support and resistance. These indicators provide Fibonacci levels that are determined by identifying two extreme points (ex. a swing high and a swing low), and dividing the vertical distance by Fibonacci ratios. Fibonacci Retracement indicators can be used in …
Moving Average Crossover Traders – How to Beat Them
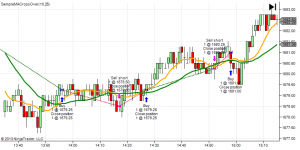
Moving Average Crossovers For many years, futures, fores, and equities traders alike have been using moving average crossovers to determine trends in the market. A very common trading strategy amongst traders is to go long when a faster moving average crosses above a slower moving average, and to go short when the faster moving average …
The Trouble With the ATR Trailing Stop Indicator
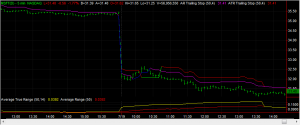
The Trouble With the ATR Trailing Stop Indicator The ATR Trailing Stop Indicator relies on the calculation of the True Range. True Range and the Average True Range (ATR) are a commonly used value in automated trading. The ATR) value is commonly used to determine volatility in the markets. It is used by Futures, Forex, …
Fibonacci Based SuperTrend Indicator
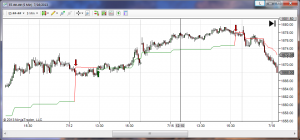
The Fibonacci SuperTrend indicator is based on one of my favorite swing trading strategies to date. While the strategy is fairly simple, the description is a bit lengthy for this post. However, there is a detailed video on the trading strategy by clicking the button below. Swing Trading Video The Original SuperTrend Indicator The …
Free Bollinger Bands – Addressing Inefficiencies With Bollinger Bands
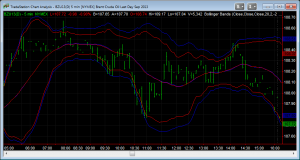
Free Bollinger Bands Indicator for TradeStation and NinjaTrader What makes our free Bollinger Bands indicator better than others? Bollinger Bands are a simple yet effective tool for measuring overbought and oversold (support and resistance) conditions in the markets. Bollinger bands are effective for Futures, Forex, and Equities trading. Typically, Bollinger Bands will plot a channel …
Point And Figure Price Action Indicator
Point And Figure Price Action Indicator Point and Figure is a charting technique used to determine trends in the market. Point and Figure charting can be used in Futures, Forex, and Equities trading. This Point and Figure based Price Action indicator for NinjaTrader includes the following features: Optional Arrows to show when the trend has …

