Free Bollinger Bands Indicator for TradeStation and NinjaTrader
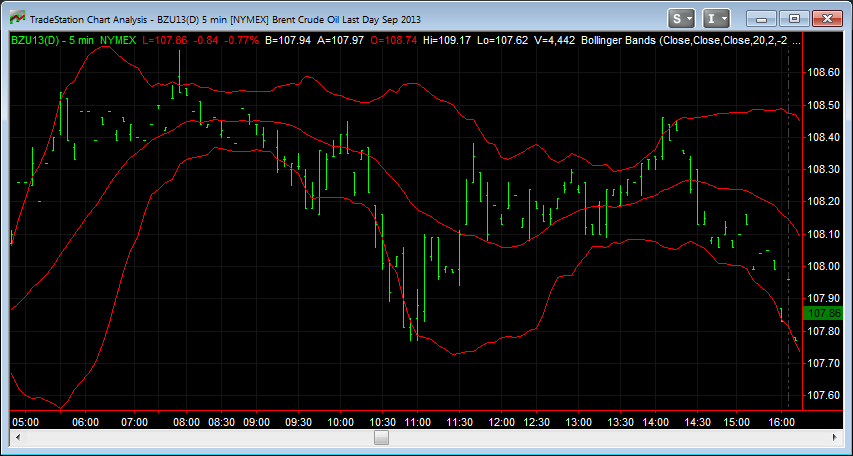
What makes our free Bollinger Bands indicator better than others? Bollinger Bands are a simple yet effective tool for measuring overbought and oversold (support and resistance) conditions in the markets. Bollinger bands are effective for Futures, Forex, and Equities trading. Typically, Bollinger Bands will plot a channel based on historical market prices and volatility. The center of the channel is generally calculated using a simple moving average. The upper and lower bands are then calculated by adding and subtracting a multiple of the Standard Deviation (used to measure volatility) from the center of the channel. The image below shows how the typical Bollinger Band indicator looks.
In this particular image, the outer bands are calculated using 2 standard deviations. In Statistics, we learn that 95% of our data set should occur within 2 standard deviations of the mean. However, when we look at the image above, we can see that the market is penetrating the outer bands on almost 18% of the bars shown. This is a large discrepancy from the 5% which statistics tells us to expect.
The reasoning for this discrepancy is due to the formulas NinjaTrader/TradeStation uses to calculate the Standard Deviation. Without going in depth about the calculations for the Standard Deviation, it is calculated based on the Deviation of each bar. The Deviation is the difference in price and the mean (the center line). Typically, TradeStation indicators will use the close of the bar as the price in the calculation for the Deviation, so the formula would be as follows:
- Deviation = Closing Price of current bar – Mean of previous ‘x’ bars (the center line)
Because the formulas are calculating the deviation for each bar based on the closing price, it is not truly representing the maximum deviation from the mean (the formula does not consider the high and low of each bar). Using this calculation, the Bollinger Bands indicator is telling us we can expect 95% of the bars to CLOSE within the outer bands, meaning we can expect prices to penetrate the outer bands more frequently.
To compensate for this behavior, we can make a simple modification to the formula for the Standard Deviation. Where the typical formula calculates the Deviation using the formula above, the new formula will be calculated using the following formula:
- HighDeviation = High Price of current bar – Mean of previous ‘x’ bars (the center line)
- LowDeviation = Mean of previous ‘x’ bars (the center line) – Low Price of current bar
- Deviation = the higher value of HighDeviation and LowDeviation
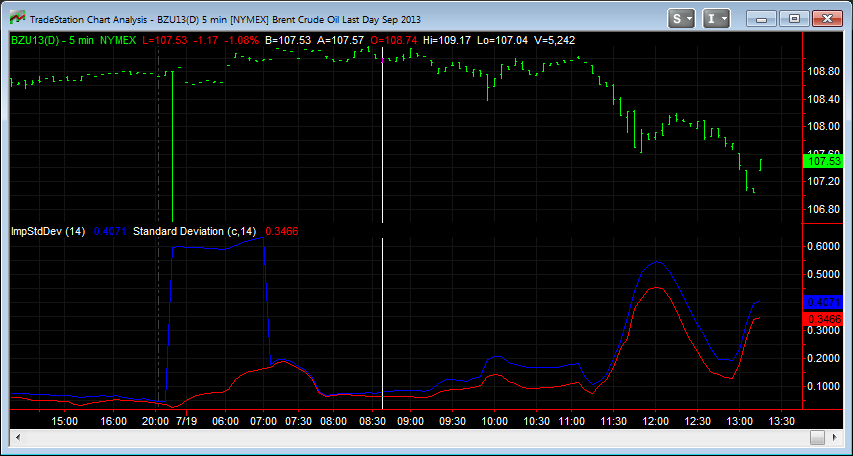
 The image above shows the difference in the formula for the typical Standard Deviation (red line) versus our new improved formula (blue line). In the image you will notice two key points:
- The value of the improved formula is always higher
- On the left hand side of the chart, there is a very large spike in the market. The red line does not account for this increased volatility because the bar closes near the same price it opened. The new improved formula detects the large spike, and increases in value accordingly.
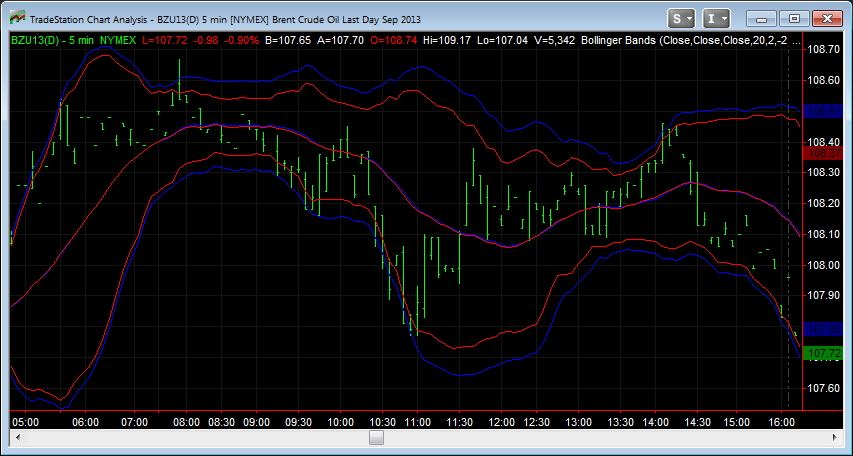
Now that we have addressed the issue with the Standard Deviation formula being used in the Bollinger Band calculation, we can create a new improved Bollinger Band indicator using the new formula. The image below shows the standard formula (red line) versus the new improved formula (blue line). Notice how many bars pierce the outer red lines, but do not pierce the outer blue lines. We now have only 10% of the bars piercing the outer blue lines, making our statistical calculations more accurate.
 Click the link below to download a free version of the Improved and Free Bollinger Band indicator for TradeStation.
Download Now:
Click the link below to download our Free Improved Bollinger Bands indicator for TradeStation:
Improved Bollinger Bands for TradeStation (2084 downloads)Click the link below to download our Free Improved Bollinger Bands indicator for NinjaTrader:
Improved Bollinger Bands Indicator for NinjaTrader 7 (1548 downloads)


2 comments
1 ping
Any chance of creating a NT8 version?
Author
I’ve got a lot on my plate at the moment, but I will see what I can do.
[…] For more information on what makes the calculations more accurate, please refer to my post on Bollinger Bands. […]