
The Trouble With the ATR Trailing Stop Indicator
The ATR Trailing Stop Indicator relies on the calculation of the True Range. True Range and the Average True Range (ATR) are a commonly used value in automated trading. The ATR) value is commonly used to determine volatility in the markets. It is used by Futures, Forex, and Equities traders alike. While The ATR is a very valuable tool in a traders arsenal, there are times when the trader should also consider an alternative.
Markets that trade 24 hours (such as Forex) do not have “gaps”. However, many markets (such as equities) do have gaps. When a market has a gap, there is a minor inefficiency in the formula for the true range that causes an artificially inflated reading. The True Range is calculated using the following formula:
- High Value = The higher value of the current bar and the previous bars closing price
- Low Value = The lower value of the current bar and the previous bars closing price
- True Range = High Value – Low Value
Because the formula is looking to the previous bar’s closing price to determine the high, any gaps in the market will be considered in the True Range calculation. However, gaps tend to form due to markets being closed, and the price movement of this gap can occur over a several hour span. Let’s have a look at the following chart.
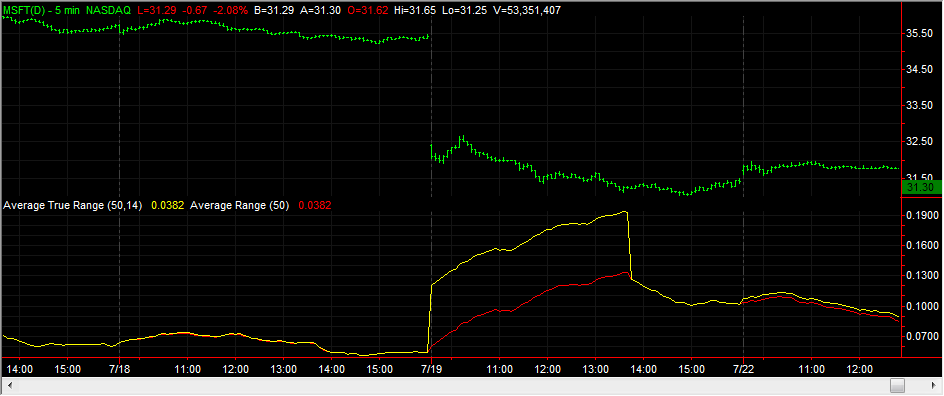
The green bars on the chart represent price action, while the yellow line represents the ATR. In the center of the chart, you see a large gap down in the market. This gap lasted from 4:00 PM to 9:30 AM, which is 17.5 hours. Since this is a 5 minute chart, the True Range should be calculating for every 5 minute period. However, due to the gap there is one bar that the True Range will spike due to the fact that it is based on a 17.5 hour period. The result is an artificially inflated Average True Range, which we see by the yellow line on the chart.
To combat this, we can simply use the Average Range opposed to the Average True Range. The Average Range only includes the high and low of the current bar, thus not accounting for gaps in the market. The Average Range is displayed in the image above as the red line. Notice how it is considerably lower than the Average True Range for several bars after the gap.
To see the difference in application, we will look at the common ATR Trailing Stop indicator. The common ATR Trailing Stop indicator will trail behind market prices based ATR value. When the market reverses and crosses above or below the line, the trend is said to reverse. The common ATR Trailing Stop indicator is displayed as the green and red line in the image below.
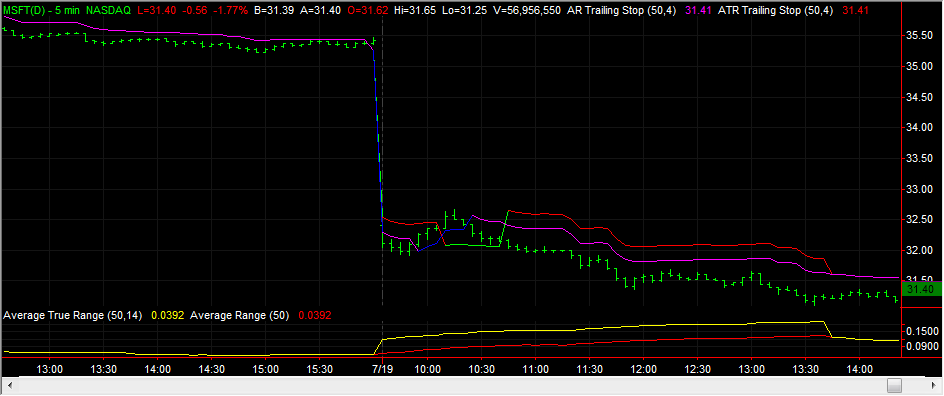
Also pictured in the image above is the Average Range indicator, which uses our improved formula as described above. The Average Range indicator is depicted by the blue and magenta line on the chart. Notice how the false increase in the ATR’s volatility calculation causes the common ATR Trailing Stop Indicator to stay a wide distance away from the market. The improved Average Range indicator is actually to detect the brief bullish trend change earlier than the common ATR indicator, thus giving more accurate signals.
Download Now:
Click the link below to download our Free ATR Trailing Stop indicator for TradeStation:
ATR Trailing Stop Indicator for TradeStation (3741 downloads)
