Harmonic Pattern Scanner for NinjaTrader

Harmonic Patterns

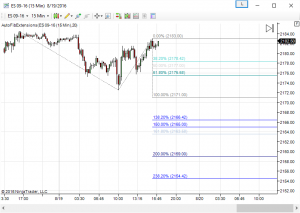
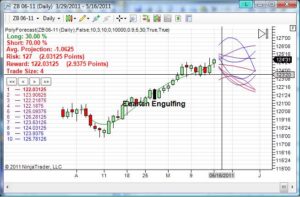
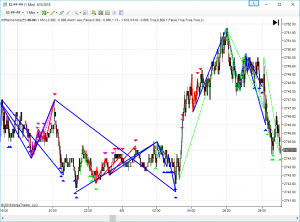
Harmonic Patterns Harmonic patterns are formed when a sequence of run-ups and pullbacks in the market adhere to predefined ratios (typically Fibonacci ratios). Many traders use Harmonic patterns in an attempt to identify key turning points in the markets, as well as predictions on future market movement. As seen in the image below, Harmonic patterns …

Continue reading

Volume Gradient Bars

Volume Gradient Bars

Volume Gradient Bars for NinjaTrader Volume information is easily accessible for traders, but many traders overlook volume since the data is a little more difficult to interpret. Our new Volume Gradient Bars indicator colors bars based on how high/low the volume was for that particular bar. This makes it much easier to interpret the information …

Continue reading

Automatic Fibonacci Extension Indicator

Fibonacci Extension Indicator

Fibonacci Extension Indicator A Fibonacci Extension indicator is often used by traders as an indication of support and resistance. These indicators provide Fibonacci levels that are determined by identifying three extreme points (ex. a swing low, a swing high, and a swing low), and dividing the vertical distance between the first two extreme points by …

Continue reading

Exponential VWAP Indicator

Exponential VWAP

Two of the most common indicators I see used by traders are the EMA (Exponential Moving Average) and VWAP (Volume Weighted Average Price). Typically, traders prefer the EMA to a standard moving average because it will react faster to price movements, causing less lag than a standard moving average. Because the VWAP indicator uses a …

Continue reading

NinjaTrader Event – November, 17th at 11am ET

NinjaTrader Event

NinjaTrader Event Join us November 17th at 11am ET to learn how to get the most bang for your buck out of NinjaTrader!   Register : http://ninjatrader.omnovia.com/register/75141447356841   You already know NinjaTrader is a free, full-featured charting and analysis platform – but what other free tools could you be lacking? What you may be missing …

Continue reading

Outside Bar Alerts – NinjaTrader Indicator

Outside-Bar-Alerts-Indicator

Outside Bar Alerts for NinjaTrader When the current bar’s high is higher than the previous bar’s high and the current bar’s low is lower than the previous bar’s low, this it called an “outside bar.” The Outside Bar Alerts Indicator will alert you when an outside bar has printed, and will also give you a …

Continue reading

Inside Bar Alerts – NinjaTrader Indicator

Inside-Bar-Alerts-Indicator

Inside Bar Alerts for NinjaTrader When the current bar’s high is lower than the previous bar’s high and the current bar’s low is higher than the previous bar’s low, this it called an “inside bar.” The Inside Bar Alerts Indicator will alert you when an inside bar has printed, and will also give you a …

Continue reading

NinjaTrader Volatility Indicator

NinjaTrader Volatility Indicator

NinjaTrader Volatility Indicator Typically in technical analysis, traders will use the Standard Deviation as a measure of volatility. While this tends to be a fairly accurate, there are some flaws in the typical calculations which I have addressed in my NinjaTrader Volatility Indicator. The first step in calculating the Standard Deviation is to calculate the …

Continue reading

Pattern Recognition Indicator For NinjaTrader

Pattern Recognition Indicator

Pattern Recognition Indicator For NinjaTrader Unlike other pattern recognition indicators, this indicator utilizes polynomials to not only identify patterns currently forming in the market, but also to analyze historical data to see how the market is likely to behave after the pattern occurs. Features *For NinjaTrader 7.0.1000.4 and later Advanced pattern recognition formula to predict …

Continue reading

Improved MACD BB Indicator

MACD_BB_Indicator for NinjaTrader

MACD BB Indicator What makes our modified MACD BB indicator for NinjaTrader better than the original version? Both the MACD and Bollinger Band indicators are simple yet effective tool for measuring overbought and oversold conditions in the markets. Bollinger Bands will plot a channel based on historical market prices and volatility. The center of the …

Continue reading