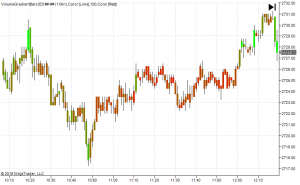
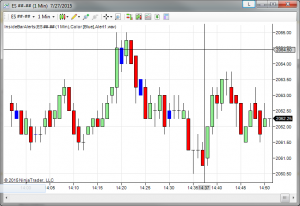
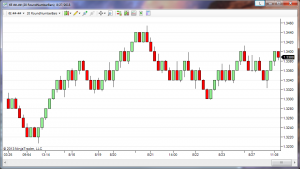
Volume Gradient Bars for NinjaTrader Volume information is easily accessible for traders, but many traders overlook volume since the data is a little more difficult to interpret. Our new Volume Gradient Bars indicator colors bars based on how high/low the volume was for that particular bar. This makes it much easier to interpret the information …
Category: Free NinjaTrader Indicators
Browse through our extensive archive of completely free NinjaTrader Indicators below. Feel free to share them with your friends via the Social Media links provided below.
Automatic Fibonacci Extension Indicator
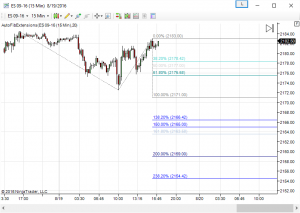
Fibonacci Extension Indicator A Fibonacci Extension indicator is often used by traders as an indication of support and resistance. These indicators provide Fibonacci levels that are determined by identifying three extreme points (ex. a swing low, a swing high, and a swing low), and dividing the vertical distance between the first two extreme points by …
Exponential VWAP Indicator
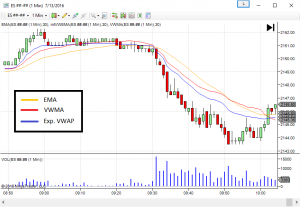
Two of the most common indicators I see used by traders are the EMA (Exponential Moving Average) and VWAP (Volume Weighted Average Price). Typically, traders prefer the EMA to a standard moving average because it will react faster to price movements, causing less lag than a standard moving average. Because the VWAP indicator uses a …
Outside Bar Alerts – NinjaTrader Indicator
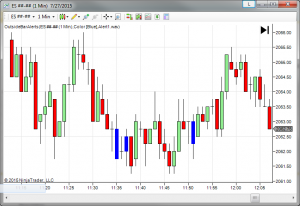
Outside Bar Alerts for NinjaTrader When the current bar’s high is higher than the previous bar’s high and the current bar’s low is lower than the previous bar’s low, this it called an “outside bar.” The Outside Bar Alerts Indicator will alert you when an outside bar has printed, and will also give you a …
Inside Bar Alerts – NinjaTrader Indicator
Inside Bar Alerts for NinjaTrader When the current bar’s high is lower than the previous bar’s high and the current bar’s low is higher than the previous bar’s low, this it called an “inside bar.” The Inside Bar Alerts Indicator will alert you when an inside bar has printed, and will also give you a …
NinjaTrader Volatility Indicator
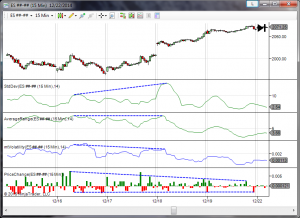
NinjaTrader Volatility Indicator Typically in technical analysis, traders will use the Standard Deviation as a measure of volatility. While this tends to be a fairly accurate, there are some flaws in the typical calculations which I have addressed in my NinjaTrader Volatility Indicator. The first step in calculating the Standard Deviation is to calculate the …
Improved MACD BB Indicator
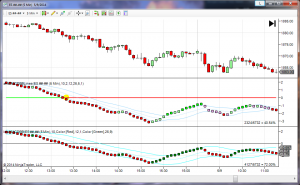
MACD BB Indicator What makes our modified MACD BB indicator for NinjaTrader better than the original version? Both the MACD and Bollinger Band indicators are simple yet effective tool for measuring overbought and oversold conditions in the markets. Bollinger Bands will plot a channel based on historical market prices and volatility. The center of the …
Swing Trading Secrets
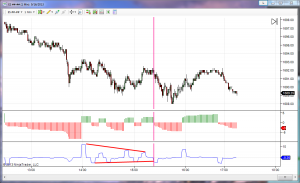
Swing Trading Secrets- Identifying Divergence and Convergence in Swings In my experience as a trader, I have found swing trading to be one of the easier methods of making consistent income. However, there are certainly Swing Trading Secrets you don’t know. While swing trading does not offer the unbelievably high rate of return that day …
Support And Resistance on Higher Time Frames
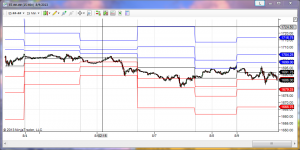
Support And Resistance Indicator for NinjaTrader Pivot points are commonly used by traders to identify key Support and Resistance levels in the markets. This indicator allows the user to display Pivot points from higher time frame charts (ex. Daily Charts), on lower time frame charts (ex. 15 minute charts). This allows you to see …
- 1
- 2

