What it does
Trend Day Strength Meter in this library is a simple session-context study. It compares extension from the session open against ATR and then multiplies that by a basic persistence check, which makes it useful as a quick bias filter rather than as a full market-regime model.
Who this is for
This page is aimed at traders who already know what problem Trend Day Strength Meter is solving and want clearer notes on setup, tradeoffs, and platform coverage.
Key terms for this tool
Review the core trading and platform terms tied to this page before changing settings or using the study in a live workspace.
What it is not
Trend Day Strength Meter is a chart-context tool. It does not place trades, manage risk automatically, or promise that a specific pattern will resolve in one direction. Use it to organize decisions, not to outsource them.
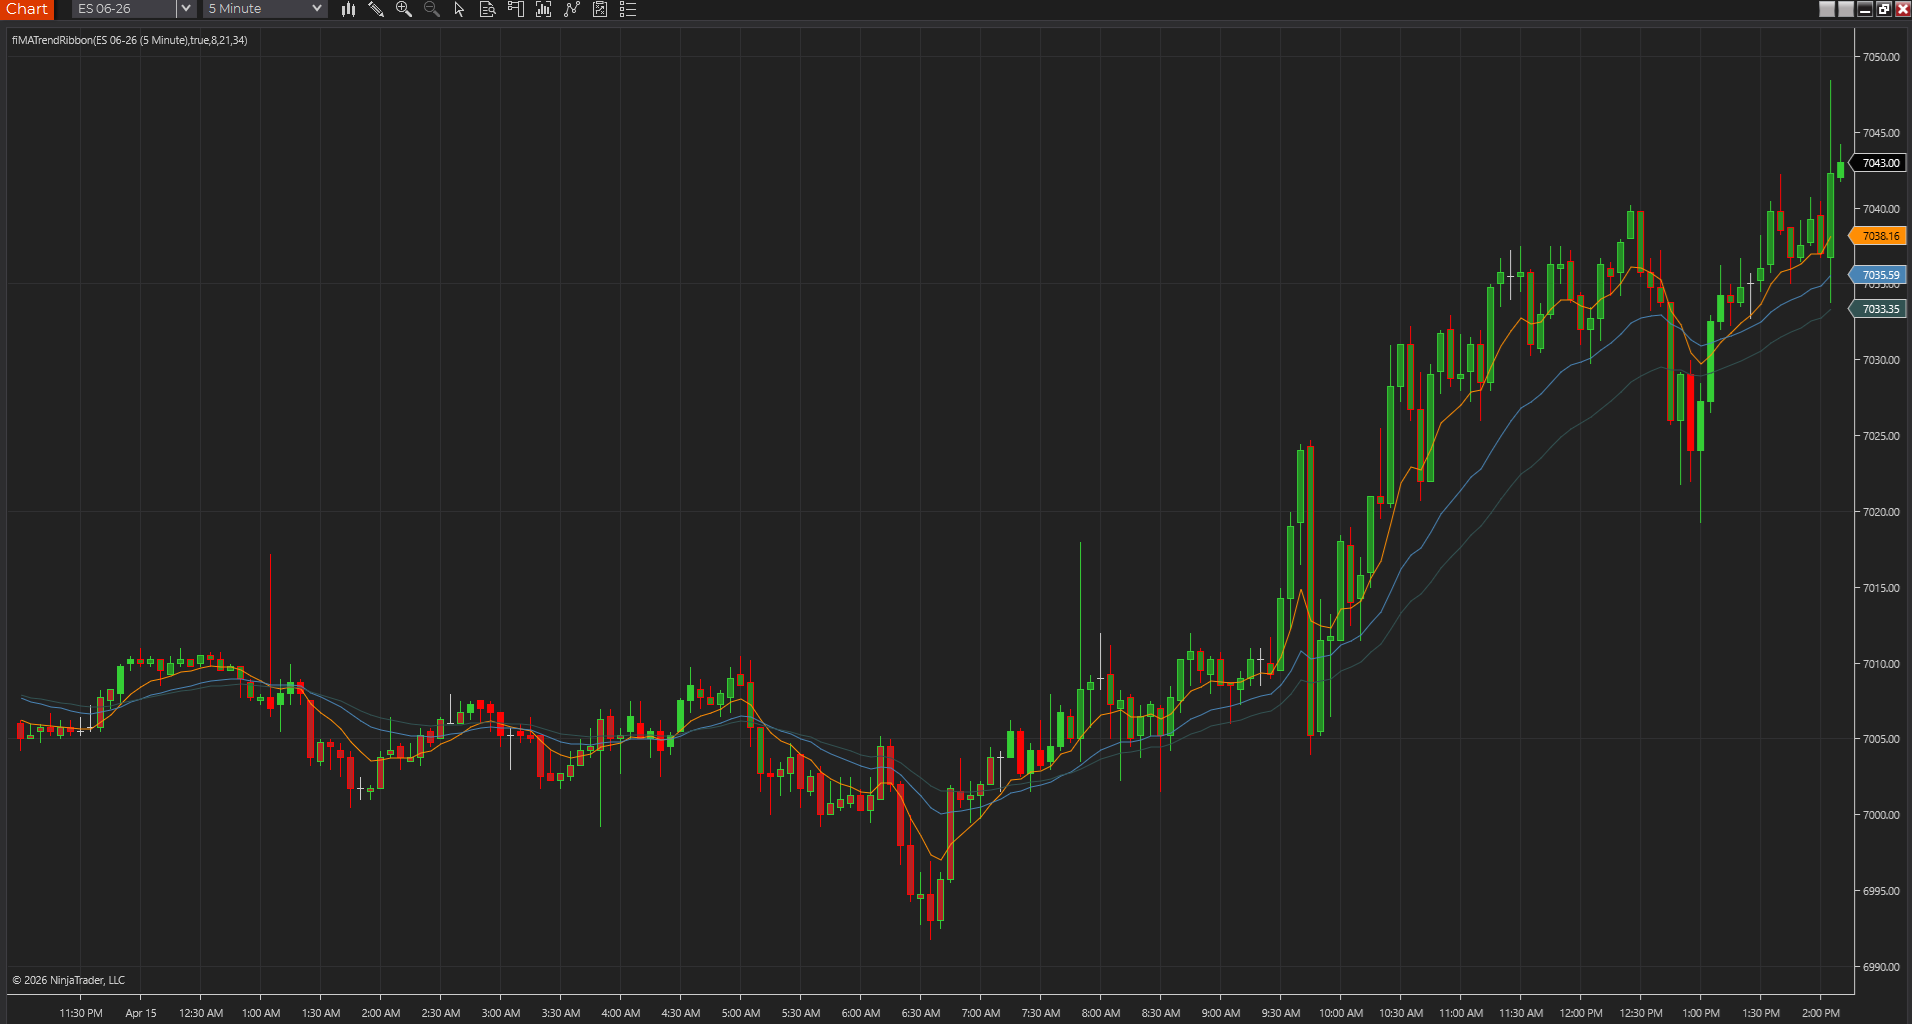
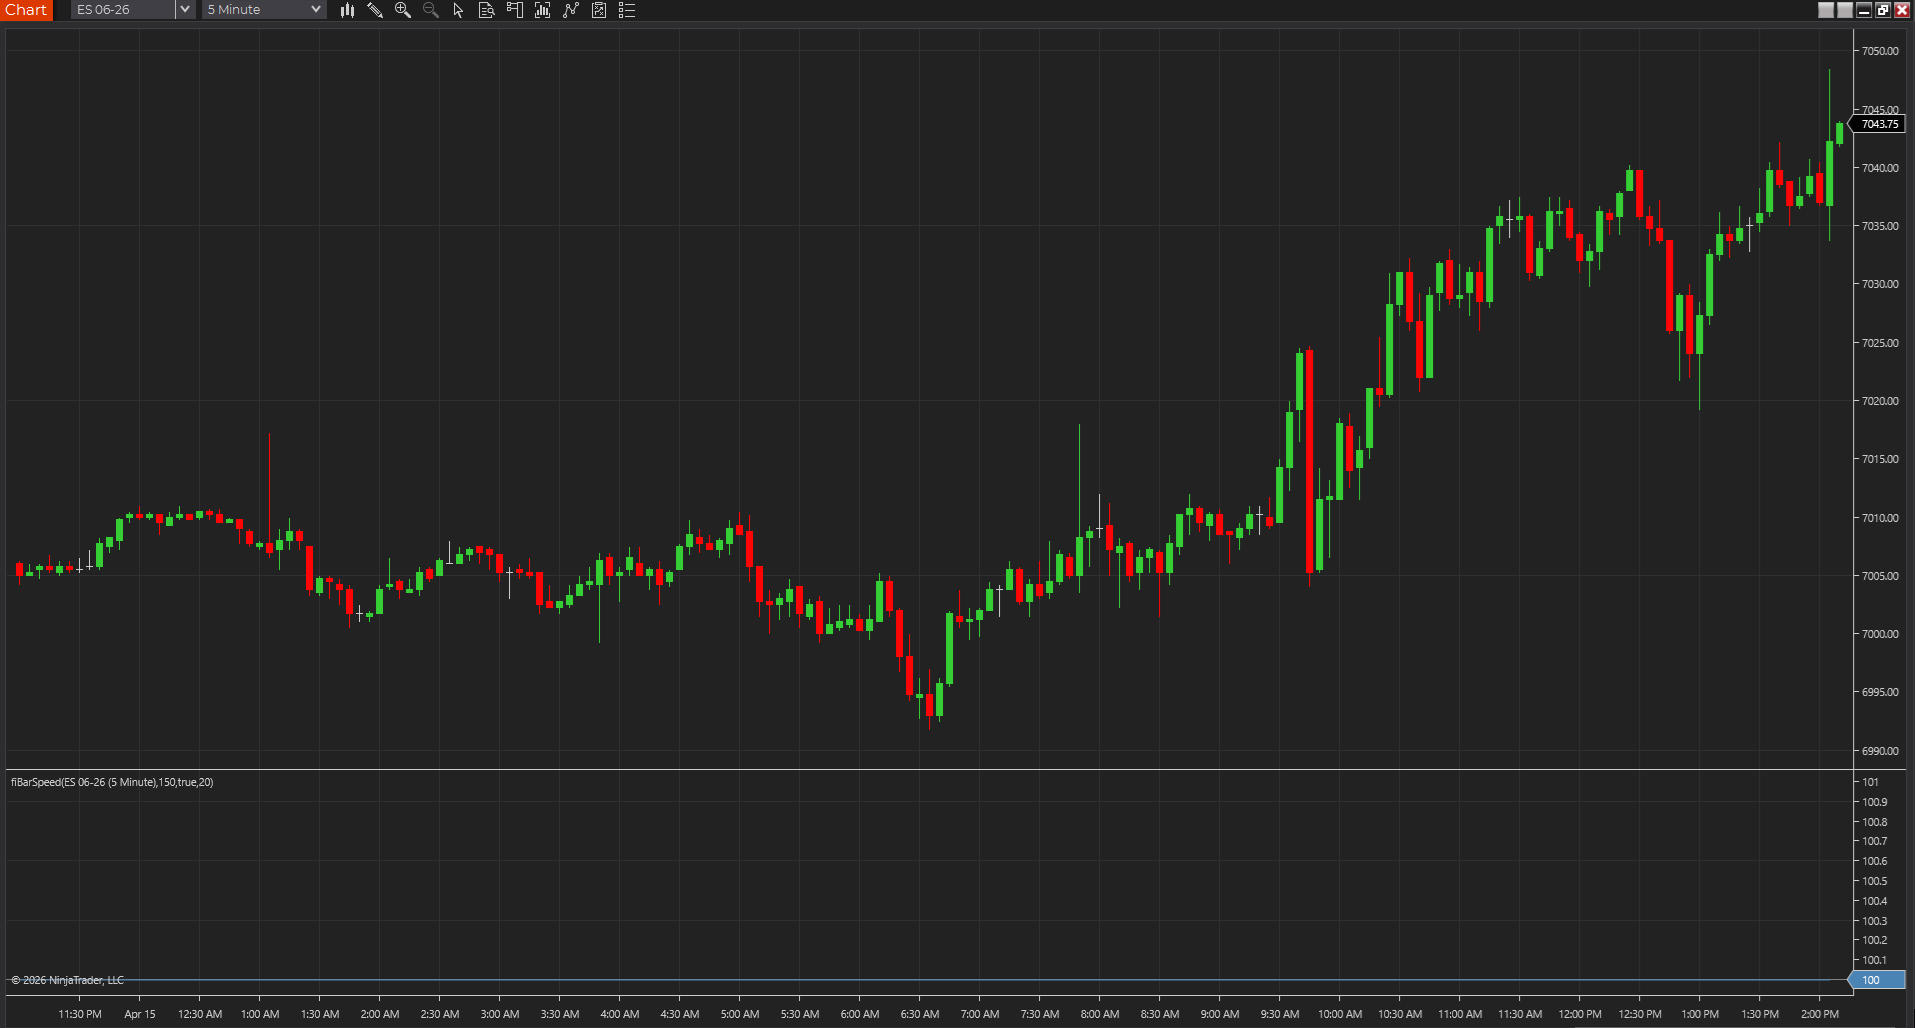
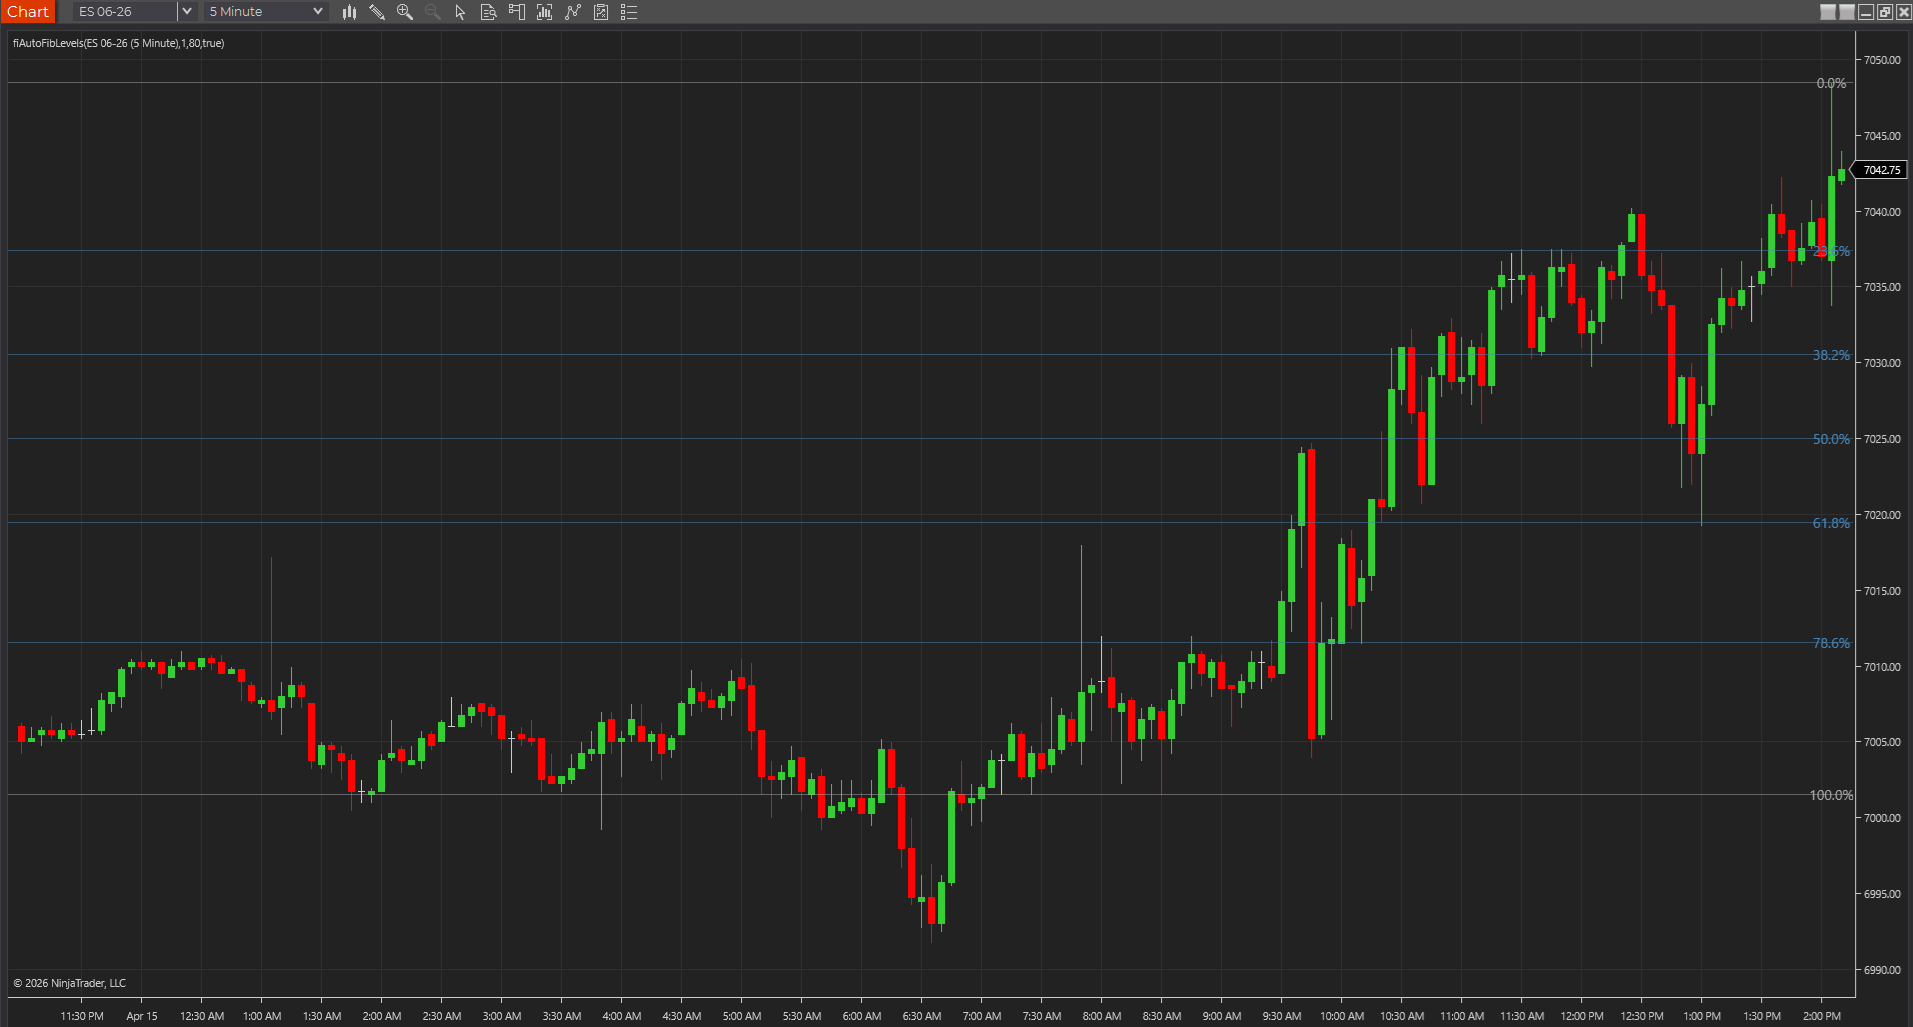
Chart examples
This chart capture shows the study on a real NinjaTrader workspace. Use it as visual reference, then confirm behavior on your own instrument, session, and timeframe.
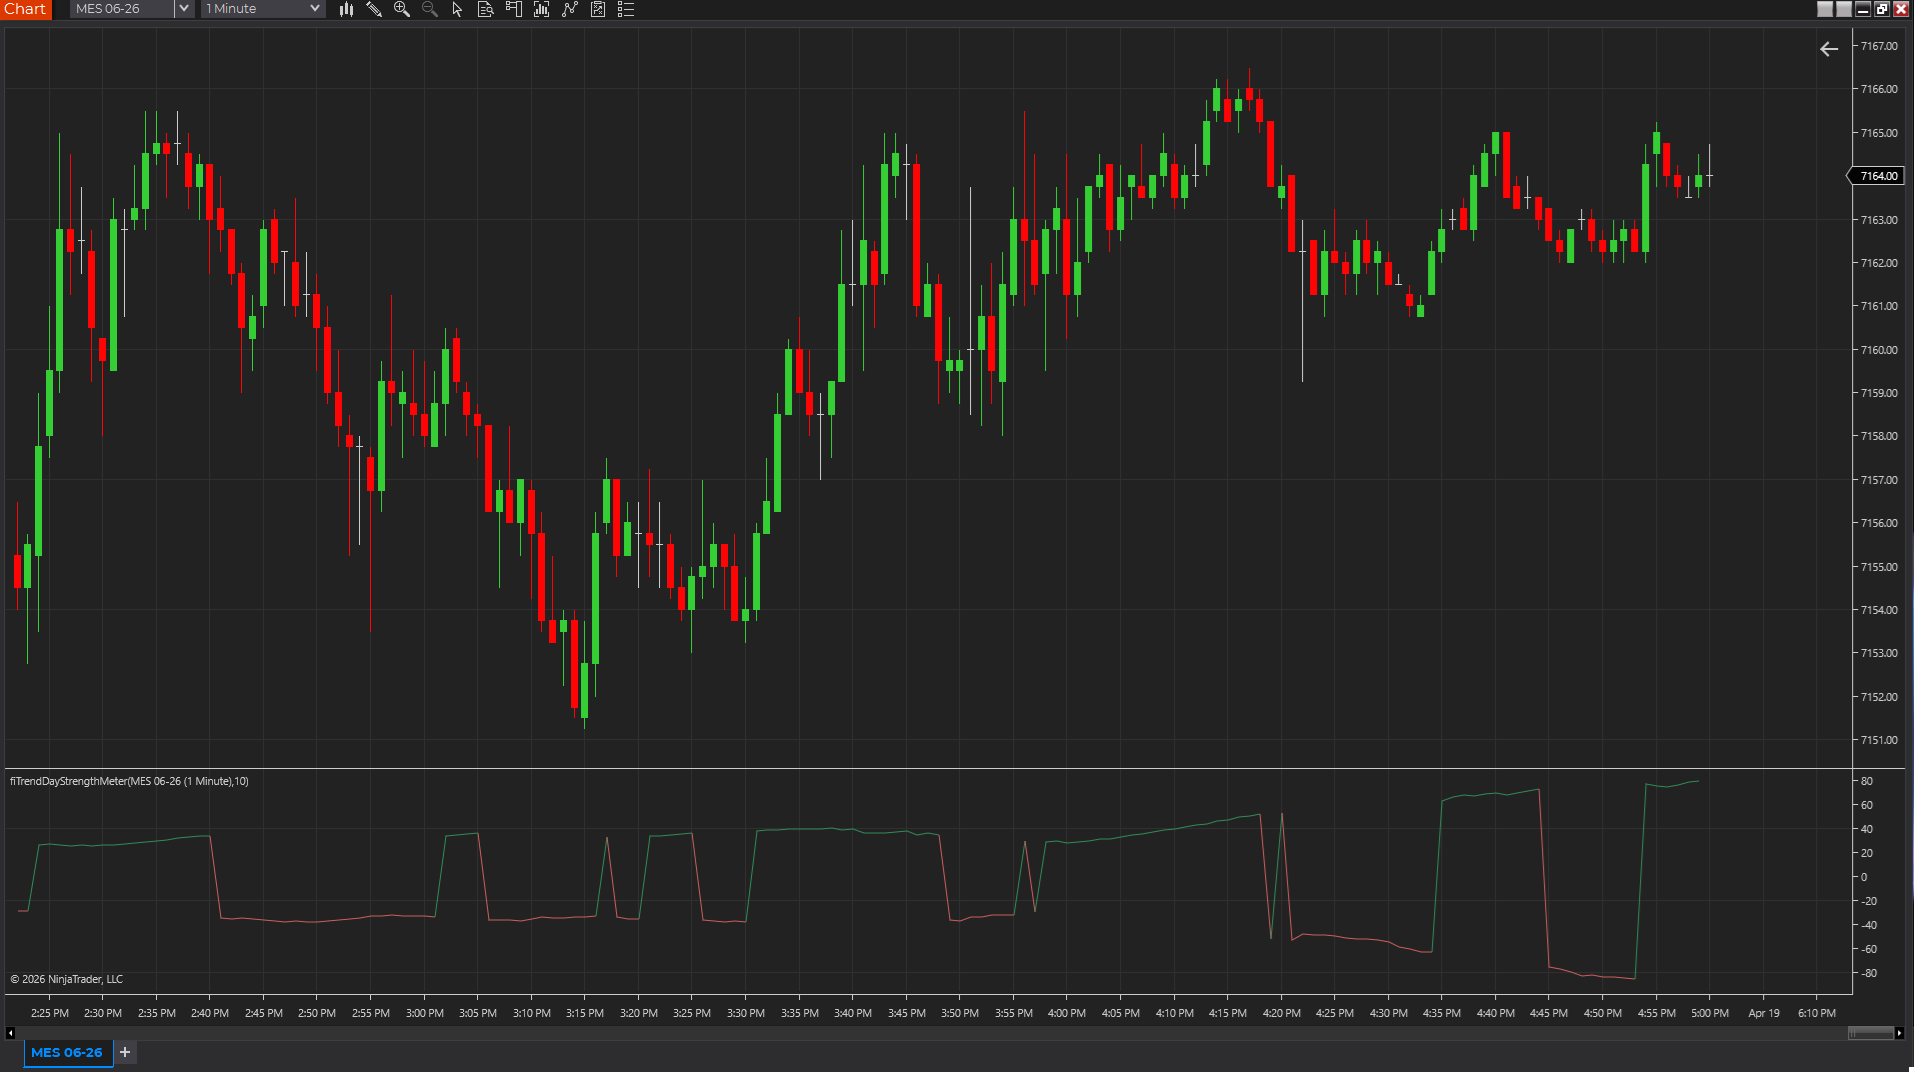
Trend-day pressure meter
A chart showing Trend Day Strength Meter scoring session-open extension and persistence in a lower panel.
Best fit
- Filtering out mean-reversion ideas on sessions that are stretching cleanly from the open.
- Checking whether direction is still persistent relative to a recent lookback window.
- Reviewing day-type behavior during replay or post-session analysis.
Before using it live
- Import the NinjaTrader 8 ZIP through NinjaTrader's normal import flow, or compile the source block for another platform in a separate panel before adding it to a live workspace.
- Compare the score against actual trend days and failed trend days from your market.
- Use it as a session filter so your main setup logic stays honest about the day type.
- Review how the tool behaves on your actual session template, chart type, and instrument.
Settings to review
Controls how many bars back the script checks when deciding whether direction is persisting.
Sets the plot color when the score is positive.
Sets the plot color when the score is negative.
Installation notes
- Import the NinjaTrader 8 ZIP through NinjaTrader's normal import flow, or compile the source block for another platform in a separate panel before adding it to a live workspace.
- Compare the score against actual trend days and failed trend days from your market.
- Use it as a session filter so your main setup logic stays honest about the day type.
Downloads
After the download
Keep the next step tied to this exact tool
Install it cleanly, subscribe for future updates if this workflow matters, or move straight into a structured request if the tool needs another platform or a custom version.
Install guide
Keep the workspace stable
Use the clean import flow before a promising download turns into a platform cleanup project.
Open install guideEmail follow-up
Get updates if this tool changes
Use the email signup if you want future indicator and workflow updates without checking back manually.
Join updatesPaid priority
Escalate when the free file is not enough
Best fit for ports, urgent fixes, or workflow-specific custom work that should not wait in the normal queue.
Open request formSource code
These source examples are provided for copy/paste workflows on other charting platforms. Review and test any script in a simulator before using it on a live chart.
{
  Trend Day Strength Meter
  FreeIndicators.com source example.
  Works as a starting point for TradeStation EasyLanguage and MultiCharts PowerLanguage.
}

Inputs: Lookback(10);
Vars: SessionOpen(0), Extension(0), Persistence(0), ATRValue(0), Score(0);

If Date <> Date[1] Then
  SessionOpen = Open;

Extension = Close - SessionOpen;
Persistence = IFF(CurrentBar > Lookback And Close > Close[Lookback], 1, -1);
ATRValue = AvgTrueRange(14);
Score = IFF(ATRValue > 0, Extension / ATRValue, 0) * Persistence;

Plot1(Score, "TrendDay");
Plot2(0, "Neutral");// Trend Day Strength Meter
// FreeIndicators.com source example for MetaTrader 4.
#property indicator_chart_window
#property indicator_buffers 3
#property indicator_color1 DodgerBlue
#property indicator_color2 Crimson
#property indicator_color3 SeaGreen
double Buffer1[];
double Buffer2[];
double Buffer3[];
int init() {
SetIndexBuffer(0, Buffer1);
SetIndexBuffer(1, Buffer2);
SetIndexBuffer(2, Buffer3);
return(0);
}
int start() {
int counted = IndicatorCounted();
int limit = Bars - counted - 1;
int lookback = 10;
double sessionOpen = Open[Bars - 1];
for(int i = Bars - 1; i >= 0; i--) {
if(TimeDay(Time[i]) != TimeDay(Time[i + 1])) sessionOpen = Open[i];
double extension = Close[i] - sessionOpen;
double direction = (i + lookback < Bars && Close[i] > Close[i + lookback]) ? 1.0 : -1.0;
double atr = iATR(NULL, 0, 14, i);
Buffer1[i] = atr > 0 ? (extension / atr) * direction : 0;
}
return(0);
}// Trend Day Strength Meter
// FreeIndicators.com source example for MetaTrader 5.
#property indicator_chart_window
#property indicator_buffers 3
#property indicator_plots 3
double Buffer1[];
double Buffer2[];
double Buffer3[];
int OnInit() {
SetIndexBuffer(0, Buffer1, INDICATOR_DATA);
SetIndexBuffer(1, Buffer2, INDICATOR_DATA);
SetIndexBuffer(2, Buffer3, INDICATOR_DATA);
return(INIT_SUCCEEDED);
}
int OnCalculate(const int rates_total,
const int prev_calculated,
const datetime &time[],
const double &open[],
const double &high[],
const double &low[],
const double &close[],
const long &tick_volume[],
const long &volume[],
const int &spread[]) {
int start = prev_calculated > 1 ? prev_calculated - 1 : 1;
int lookback = 10;
double sessionOpen = open[0];
for(int i = 0; i < rates_total; i++) {
MqlDateTime dt, prev; TimeToStruct(time[i], dt);
if(i == 0) sessionOpen = open[i];
else { TimeToStruct(time[i - 1], prev); if(dt.day != prev.day) sessionOpen = open[i]; }
double extension = close[i] - sessionOpen;
double direction = (i >= lookback && close[i] > close[i - lookback]) ? 1.0 : -1.0;
double atr = iATR(_Symbol, PERIOD_CURRENT, 14);
Buffer1[i] = atr > 0 ? (extension / atr) * direction : 0;
}
return(rates_total);
}//@version=5
indicator("Trend Day Strength Meter", overlay=true)
lookback = input.int(10, "Lookback", minval=1)
newSession = ta.change(time("D"))
var float sessionOpen = na
sessionOpen := newSession ? open : nz(sessionOpen[1], open)
extension = close - sessionOpen
direction = bar_index >= lookback and close > close[lookback] ? 1.0 : -1.0
atrValue = ta.atr(14)
trendScore = atrValue > 0 ? (extension / atrValue) * direction : 0
plot(trendScore, "Trend day strength", color=trendScore >= 0 ? color.green : color.red, linewidth=2)
hline(0, "Neutral", color=color.gray)Limitations
- Trend-day conditions can fade quickly after a strong start.
- The score is based on session-open extension and simple persistence, not a full day-type engine.
- Different markets need different thresholds to feel useful.
Frequently asked questions
Does it repaint?
This tool can revise its most recent labels or levels until enough bars have formed to confirm the swing or range it is using. Older confirmed values should be more stable than the most recent developing ones.
Which platforms are covered?
NinjaTrader 8, TradeStation EasyLanguage, MultiCharts PowerLanguage, MetaTrader 4, MetaTrader 5, TradingView Pine Script are currently represented through downloads or source pages.
Is source code included?
Yes. This page includes source examples or links to platform-specific source pages where applicable.